Best Profit Analytics for Shopify Brands in India (2026 Comparison)
Profit analytics options for Indian Shopify brands compared: Shopify's own reports, spreadsheets, Triple Whale, Northbeam, Polar Analytics and Tera Ads, with prices.
On this page
The best profit analytics for an Indian Shopify brand is the one that shows profit after ad spend and RTO, campaign by campaign, at a price that fits your ad budget. Shopify's own reports and spreadsheets are free but partial or slow. Triple Whale, Northbeam and Polar Analytics are powerful dollar-priced platforms built mainly around attribution or data warehousing. Tera Ads is free for one business and built around profit after returns.
Key takeaways
- Start from the decisions you make weekly: budget, which campaigns to scale, and whether last month made money.
- For COD-heavy brands, profit must include RTO from your courier, counted in the order's month.
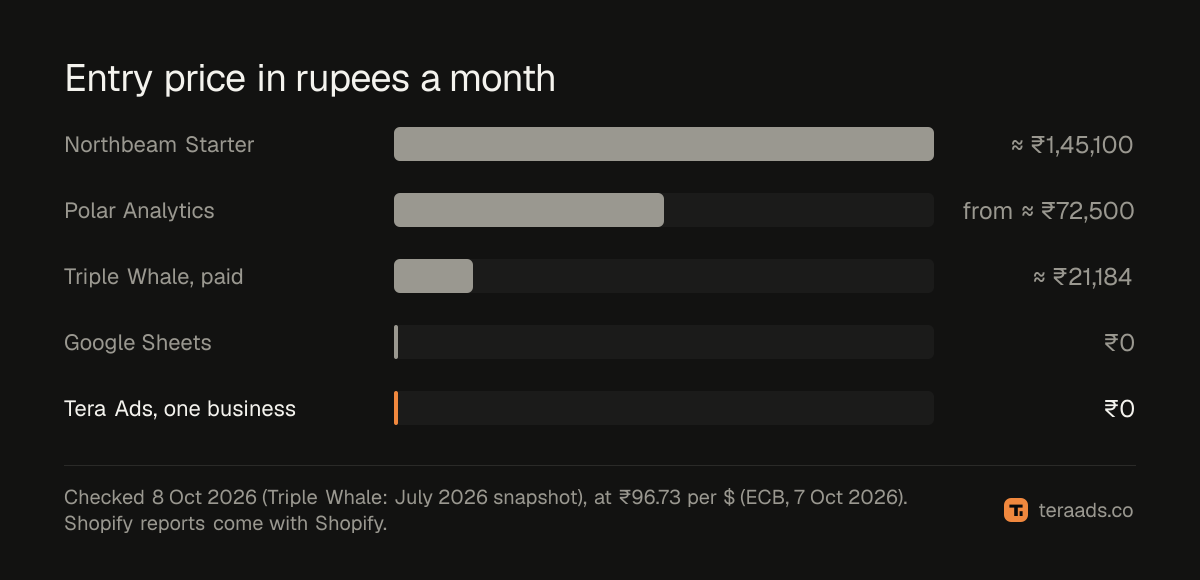
- US-built platforms are priced in dollars, from about $219 to $3,500 a month at entry and mid tiers.
- Shopify reports and spreadsheets are free but either miss returns or cost time every week.
- Check any tool against your own numbers for a settled month before trusting it.
How we compared
We judged each option on what an Indian D2C founder needs every week: Shopify revenue as truth, ad spend from Meta and Google, profit after product costs, shipping, fees and RTO, and every campaign side by side. Prices come from each vendor's pricing page or Shopify App Store listing where available, or from dated third-party snapshots, as noted. Rupee figures use ₹96.73 to the dollar (ECB rate, 7 October 2026). Our editorial standards explain how we compare tools that include our own.
The options at a glance
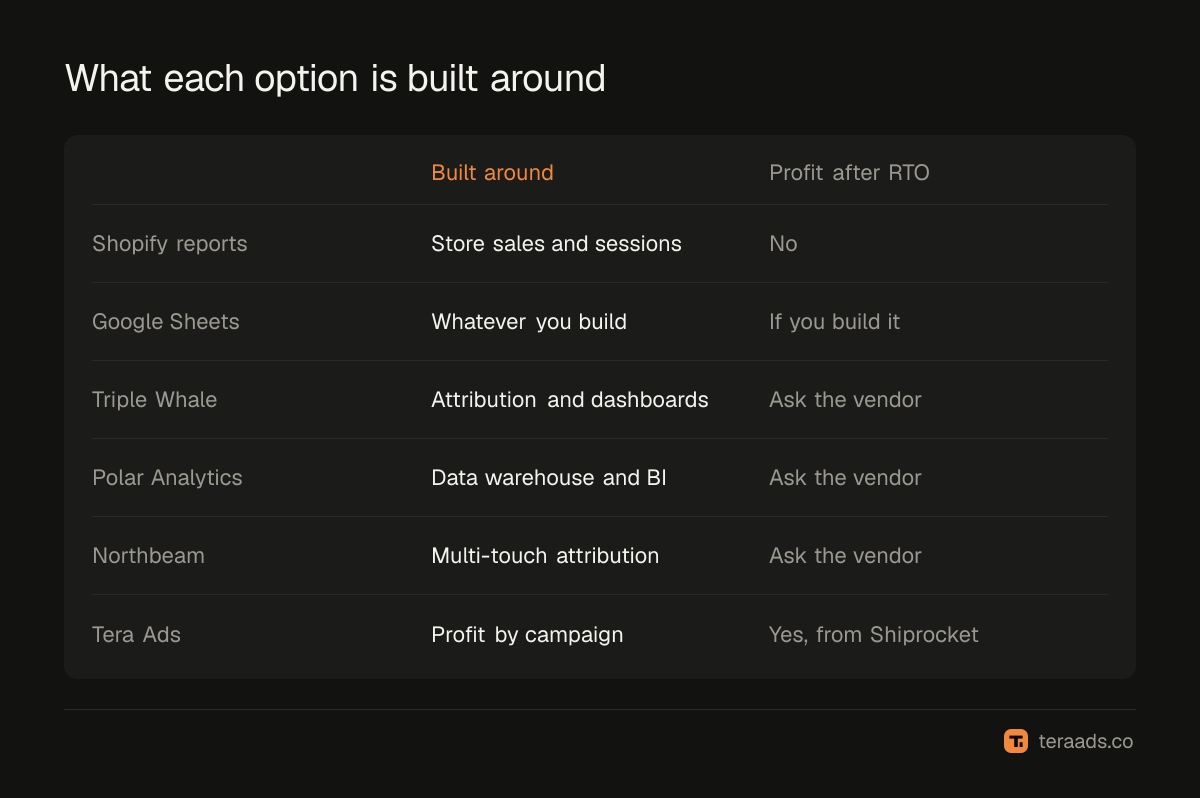
| Option | Starting price | Built around | Profit after RTO |
|---|---|---|---|
| Shopify reports | Included with Shopify | Store sales and sessions | No |
| Google Sheets | Free | Whatever you build | Yes, if you build it |
| Triple Whale | Free plan; paid from about $219/month (July 2026 snapshot) | Attribution and dashboards | Ask the vendor |
| Polar Analytics | From $750/month (Shopify App Store) | Data warehouse and BI | Ask the vendor |
| Northbeam | $1,500, usage-based (pricing page) | Multi-touch attribution | Ask the vendor |
| Tera Ads | Free for one business | Profit after returns by campaign | Yes, RTO from Shiprocket |
Shopify's own reports
Shopify Analytics shows sales, orders, sessions and attribution by channel, and can show gross profit when you enter product costs. It doesn't subtract shipping, payment fees or returns from your courier by default, and ad spend lives in the ad platforms. It's the right place for store truth, not for profit by campaign. Shopify analytics vs dedicated tools covers the gap.
Spreadsheets
A Google Sheet can calculate everything, including RTO by campaign, for free. The cost is 30–60 minutes or more a week, plus the risk of errors. It suits early-stage brands and anyone still deciding what to measure; the Google Sheets dashboard guide has a structure.
Triple Whale
A mature platform with its own attribution pixel, deep dashboards and creative analytics. Paid plans are priced by GMV in dollars; a July 2026 snapshot lists Foundation from $219 a month for stores under $250K GMV. Strongest for prepaid-heavy brands with analysts and many channels. See the Triple Whale comparison.
Polar Analytics
A data platform with a dedicated Snowflake warehouse, custom reports, attribution and add-ons such as incrementality testing. Its Shopify App Store listing shows a Core Plan from $750 a month, priced by online GMV. Best for brands with many data sources and someone to build reports. See the Polar comparison.
Northbeam
A multi-touch attribution platform for large ad budgets. Its pricing page lists Starter at $1,500 (usage-based) and Professional at $3,500 a month on an annual term. Best for brands spending heavily across many channels. See the Northbeam comparison.
Tera Ads
Built for Indian Shopify brands on Meta Ads and Google Ads. Profit after RTO is the headline number, using shipment outcomes from Shiprocket counted in the month the order was placed. Every Meta and Google campaign sits in one table with winners and money-wasters marked, and deep dives cover wasted search terms, disapproved Shopping products, Meta audience overlap and creatives. It's free for one business. It doesn't offer multi-touch attribution with its own pixel or a custom report builder.
How to choose
- Mostly COD, Meta and Google, small team: a tool that includes RTO by campaign, such as Tera Ads, or a well-built sheet.
- Prepaid-heavy, many channels, analyst on staff: Triple Whale, Polar or Northbeam, depending on whether you need attribution, a warehouse or both.
- Very large multi-channel budgets: Northbeam or Polar, and consider marketing mix modelling.
- Unsure: start free, measure for a month, and only pay when you know what you need.
Questions to ask before choosing
- Is revenue taken from Shopify or from the ad platforms?
- Is RTO from my courier included, and in which month?
- How does the price change as GMV or traffic grows?
- What's the contract term?
- Can I export my data if I leave?
What switching costs
Changing analytics tools costs more than the subscription. Historical data may not carry over, so trends restart. Definitions differ: one tool counts revenue on order date, another on payment date; one treats refunds as negative revenue, another as a cost. Your team has to learn new screens and trust new numbers.
Before switching, export a full year of your current reports, write down how each key number is defined, and run the new tool beside the old one for a month. If they disagree by more than a few per cent on spend, revenue or profit for a settled month, find out why before relying on either. For COD brands, pay special attention to how each tool treats an order placed in one month and refused in the next; it changes which month looks profitable. The goal isn't the most sophisticated tool; it's numbers your team believes and acts on every week.
Common mistakes
Choosing on feature count. Choose on weekly decisions.
Comparing dollar prices without converting. Compare in rupees against your ad spend.
Ignoring RTO. Profit without returns is overstated for COD brands.
Skipping the reconciliation. Check any tool against Shopify for a settled month.
Frequently asked questions
What is the best profit analytics tool for Shopify in India?
One that uses Shopify revenue, includes RTO from your courier and shows every Meta and Google campaign. Tera Ads is free for one business and does all three.
How much do Shopify analytics tools cost?
From free (Shopify reports, sheets, Tera Ads) to dollar subscriptions: Triple Whale from about $219 a month, Polar from $750 and Northbeam from $1,500, at the dates noted above.
Does Shopify show profit after returns?
Not by default. It can show gross profit when product costs are entered, but not shipping, fees and courier returns.
Do I need multi-touch attribution?
Usually not for a brand mainly on Meta and Google. UTMs, Shopify attribution, MER and simple tests answer most questions.
Which tool includes RTO from Shiprocket?
Tera Ads subtracts RTO using Shiprocket shipment outcomes, counted in the month the order was placed. Ask other vendors how they handle it.