Build an Ads Dashboard in Google Sheets: Meta, Google and Shopify
A step-by-step Google Sheets dashboard for Meta Ads, Google Ads and Shopify: the tabs to create, the formulas for real ROAS and MER, and how to keep it up to date.
On this page
A Google Sheets ads dashboard needs four data tabs (Meta spend, Google spend, Shopify orders and shipment outcomes) and one summary tab that calculates spend, revenue, MER and real ROAS by week and campaign. Paste or import fresh exports weekly, join orders to campaigns with UTMs and to delivery outcomes by order number, and use simple SUMIFS formulas. It's free and flexible; the cost is your time each week.
Key takeaways
- Keep raw exports in their own tabs and never edit them; calculate everything in a summary tab.
- Use Shopify orders as revenue and the ad platforms only for spend.
- Join orders to campaigns with UTM campaign names and to RTO outcomes by order number.
- MER and real ROAS on kept orders are the two numbers worth putting at the top.
- Plan for 30–60 minutes a week to refresh and check it.
The structure
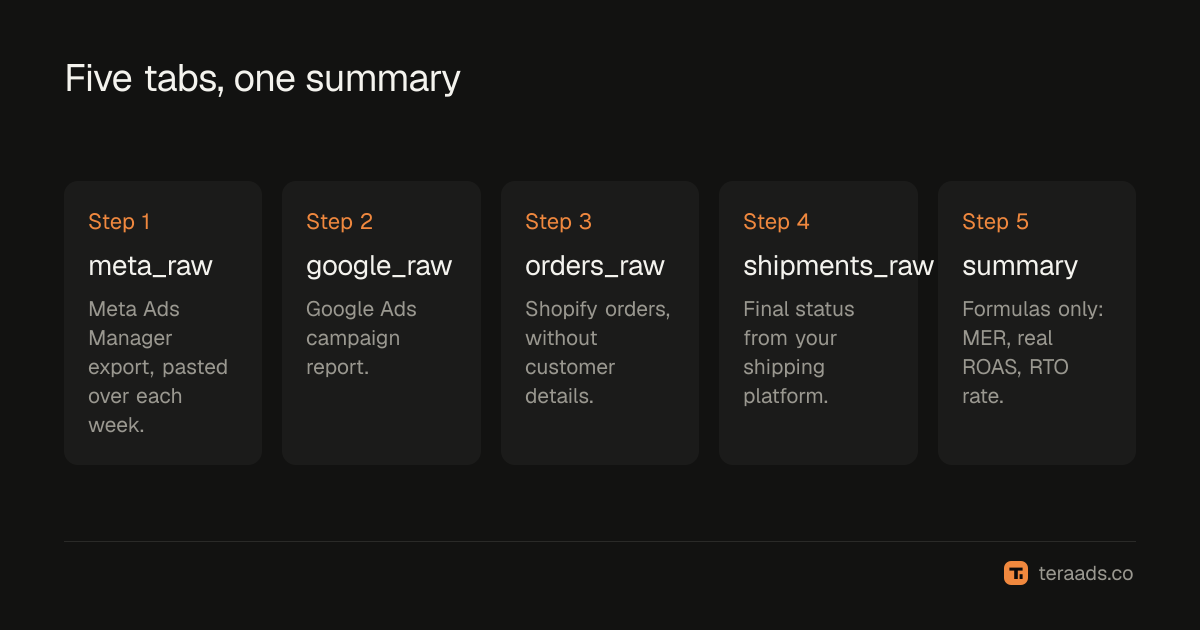
| Tab | What goes in it | Source |
|---|---|---|
| meta_raw | Date, campaign, spend, purchases, purchase value | Meta Ads Manager export |
| google_raw | Date, campaign, cost, conversions, conversion value | Google Ads report |
| orders_raw | Order number, date, total, payment method, UTM campaign, status | Shopify orders export, without customer details |
| shipments_raw | Order number, final status | Shipping platform export |
| summary | Weekly totals, MER, campaign table, real ROAS | Formulas only |
Building it, step by step
- Create the five tabs above and paste one export into each raw tab, with headers in row 1.
- Add a week column to each raw tab, for example
=A2-WEEKDAY(A2,3)for a Monday-start week, so data can be grouped by week. - Add delivery status to orders. In orders_raw, look up each order's outcome:
=IFERROR(VLOOKUP(A2, shipments_raw!A:B, 2, FALSE), "pending"). - Build the weekly summary. Total spend is
=SUMIFS(meta_raw!C:C, meta_raw!F:F, A2) + SUMIFS(google_raw!C:C, google_raw!F:F, A2); total revenue is the SUMIFS of order totals for the week. - Calculate MER as revenue divided by spend for each week; see MER vs ROAS.
- Build the campaign table. For each campaign, sum spend from the ad tabs and kept revenue from orders whose UTM campaign matches and whose status is delivered.
- Calculate real ROAS as kept revenue divided by spend, beside the platform's own ROAS.
Adjust the column letters to match your exports. Keep campaign names consistent between your ads and UTMs, or the joins won't match; the UTM guide has a naming scheme.
The summary that matters
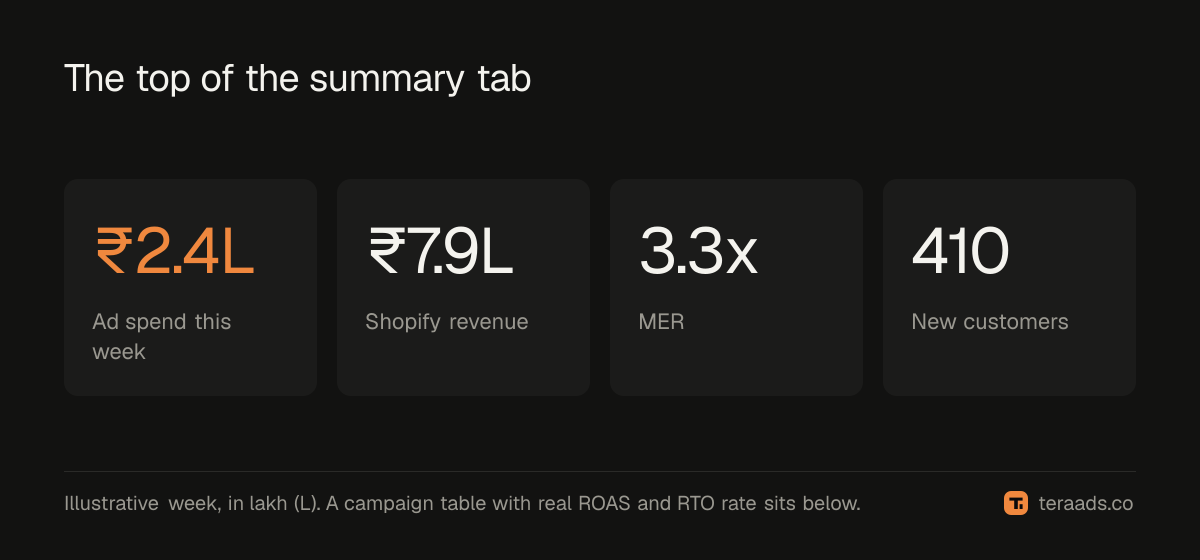
Put four numbers at the top for the latest week, each with the previous week beside it: total ad spend, Shopify revenue, MER and new customers. Below, a campaign table with spend, platform ROAS, real ROAS on kept orders and RTO rate. Use conditional formatting to colour real ROAS below your break-even red. Break-even ROAS gives the formula.
Getting data in
- Manual exports. Free and reliable. Export each source weekly and paste over the raw tab.
- Scheduled reports. Meta Ads Manager can email scheduled reports, and Google Ads can schedule reports, including to Google Sheets, which saves a step.
- Connectors. Paid add-ons can pull Meta, Google and Shopify data into Sheets automatically. Check what they cost and where they process data.
- Looker Studio. Google's free reporting tool connects natively to Google Ads, GA4 and Sheets, so you can build charts on top of the sheet. Meta data usually needs a partner connector.
Keeping it honest
- Only use settled orders for RTO. Orders from the last three weeks are still in transit; label them pending.
- Check totals weekly. Spend in the sheet should match Ads Manager and Google Ads; revenue should match Shopify.
- Watch unmatched orders. Orders without a UTM campaign show where tagging is missing.
- Protect formulas. Lock the summary tab so nobody types over a formula.
When a spreadsheet stops being enough
Sheets works well for one brand with a few campaigns. It strains when you have many campaigns, several people editing, or need daily rather than weekly numbers. Formula errors become hard to spot, and the weekly refresh grows. Spreadsheet vs dashboard covers how to decide when to move.
Formulas worth adding
Once the basics work, a few extra calculations make the sheet far more useful:
- New customers. If your Shopify export includes a first-order flag or customer order count, count first orders per week, then divide total spend by that count for a blended cost per new customer; see blended CAC.
- RTO rate by campaign. For settled orders, divide RTO orders by delivered plus RTO orders for each UTM campaign.
- Week-on-week change. Beside each headline number, show the percentage change from the previous week, so movements stand out.
- Break-even line. Put your break-even ROAS in one cell and refer to it in conditional formatting, so changing it updates every colour.
- Product view. A pivot table of kept revenue by product shows which products deserve ad budget.
Sharing the sheet
If others read the sheet, give them view access, or share only the summary tab, so nobody edits a formula by accident. Put a short notes section at the top explaining definitions: which orders count as revenue, how RTO is treated and which attribution setting the platform ROAS uses. Add the date of the last refresh in a cell beside it, so readers know how fresh the numbers are. Clear definitions prevent most arguments about whose number is right.
Common mistakes
Using platform revenue. Meta and Google overlap; Shopify orders are the truth.
Editing raw tabs. Keep exports untouched so you can paste over them.
Mismatched campaign names. UTMs and ad names must match for the joins to work.
Counting recent RTO. Wait until orders settle.
No reconciliation. One wrong total spoils every number below it.
Tera Ads does these joins automatically: Shopify orders, RTO from Shiprocket, and Meta Ads and Google Ads spend, with real ROAS for every campaign on one screen. It is free for one business.
Frequently asked questions
How do I make a Facebook ads dashboard in Google Sheets?
Export Meta Ads Manager data weekly into a raw tab, then summarise spend and results by week and campaign with SUMIFS formulas in a separate tab.
Can Google Sheets pull Meta Ads data automatically?
Not natively. Use scheduled email reports, manual exports or a paid connector add-on.
How do I calculate real ROAS in Google Sheets?
Look up each order's delivery status, sum revenue from delivered orders per UTM campaign, and divide by that campaign's spend.
Is Looker Studio free?
Yes. It connects natively to Google Ads, GA4 and Google Sheets. Meta Ads usually needs a partner connector, which may be paid.
How long does a Sheets dashboard take to maintain?
Typically 30–60 minutes a week for exports, pasting and checks, more as campaigns multiply.