Contribution Margin for D2C Brands: CM1, CM2 and CM3 Explained
Contribution margin shows what each order leaves after the costs it causes. How to work out CM1, CM2 and CM3 for a Shopify brand, with RTO and ad spend included.
On this page
Contribution margin is what an order leaves after the costs that order causes. D2C brands usually split it in three: CM1 is revenue minus product cost; CM2 also takes off shipping, payment fees, packaging and returns; CM3 also takes off marketing. CM2 tells you whether an order is worth having; CM3 tells you whether your ads make money. Fixed costs like salaries and rent come after CM3.
Key takeaways
- CM1 = net revenue − product cost. CM2 = CM1 − costs of fulfilling and collecting the order. CM3 = CM2 − marketing.
- For Indian D2C, returns to origin belong in CM2, not hidden in "other costs".
- Your break-even ROAS comes from CM2: break-even ROAS = 1 ÷ CM2 as a share of revenue.
- Positive CM3 means each month's orders cover their ads; fixed costs still have to come out of it.
- Calculate on net revenue after discounts, taxes, cancellations and returns.
Why gross margin isn't enough
Gross margin, revenue minus product cost, says a product is profitable. But an ₹800 necklace with a ₹320 cost can still lose money once you ship it, pay a COD fee, have a quarter of COD orders come back and pay for the ad that sold it. Contribution margin follows the money one step further each level, so you can see where it goes.
The three levels
| Level | Formula | What it answers |
|---|---|---|
| CM1 | Net revenue − product cost (COGS) | Is the product priced well? |
| CM2 | CM1 − shipping − payment and COD fees − packaging − RTO and return costs | Is each order worth fulfilling? |
| CM3 | CM2 − marketing (ad spend, influencers, discounts paid for by marketing) | Do the ads pay for themselves? |
| Operating profit | CM3 − fixed costs (team, rent, software) | Does the business make money? |
Some teams define the levels slightly differently, for example putting payment fees in CM1. That's fine; what matters is using the same definitions every month.
A worked example
Monthly numbers for an illustrative jewellery brand:
- Net revenue (after discounts, GST and cancellations): ₹10,00,000
- Product cost: ₹3,80,000
- Shipping (forward and RTO legs): ₹1,10,000
- Payment gateway and COD fees: ₹35,000
- Packaging: ₹20,000
- Lost revenue and write-offs from RTO and returns: ₹90,000
- Ad spend: ₹2,40,000
CM1 = ₹10,00,000 − ₹3,80,000 = ₹6,20,000 (62%).
CM2 = ₹6,20,000 − ₹1,10,000 − ₹35,000 − ₹20,000 − ₹90,000 = ₹3,65,000 (36.5%).
CM3 = ₹3,65,000 − ₹2,40,000 = ₹1,25,000 (12.5%).
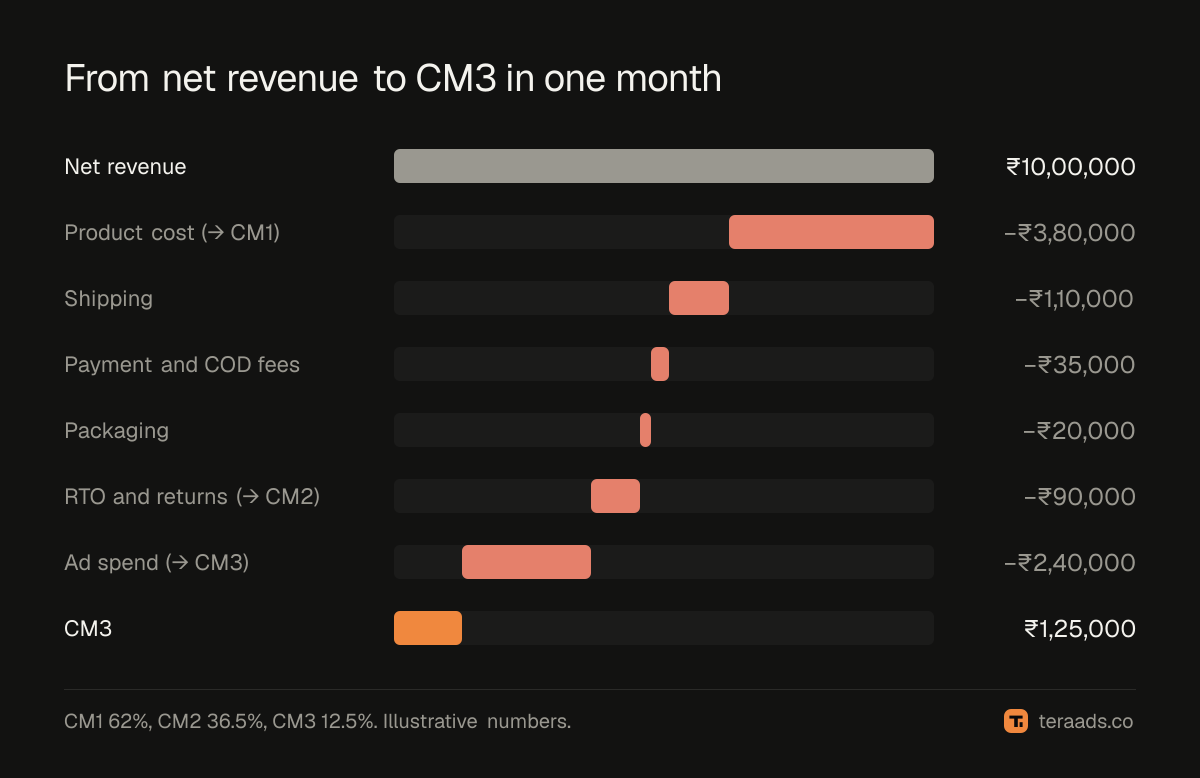
At 62%, the product margin looks comfortable. By CM2 it's 36.5%. After ads, 12.5% is left to cover the team, rent and tools. That gap is why brands that track only gross margin are surprised by their bank balance.
Where RTO goes
For Indian D2C brands, returns to origin are often the biggest cost hiding between CM1 and CM2. An RTO costs the shipping both ways, packaging, sometimes damaged stock, and the sale itself. Count RTO in the month the order was placed, so each month's contribution margin reflects the orders it sold, as explained in Shopify profit tracking.
How CM2 sets your ad targets
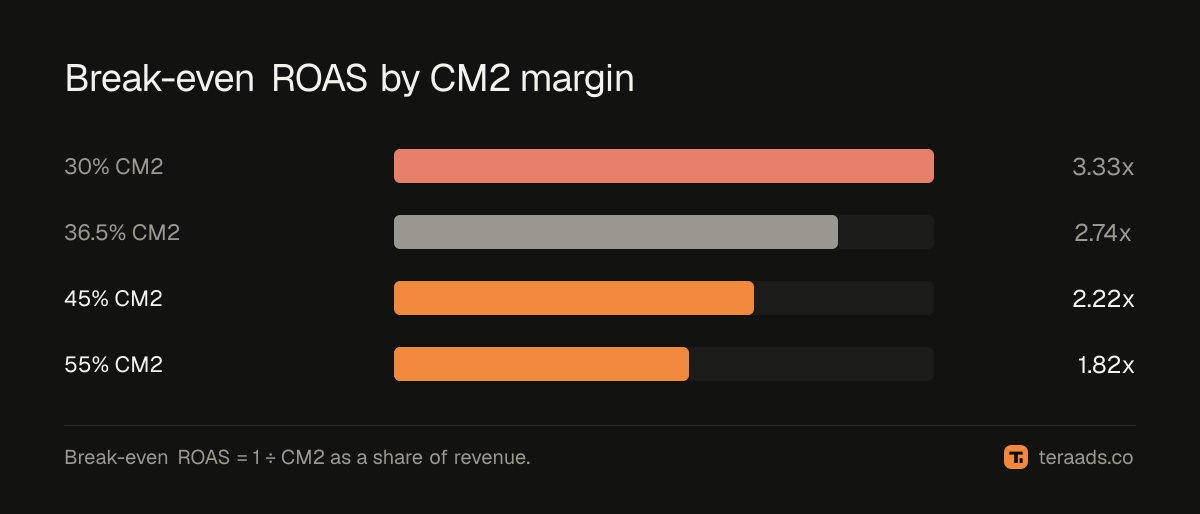
CM2 as a share of revenue is the margin that ads have to work within. If CM2 is 36.5%, every rupee of ad spend needs to bring at least ₹2.74 of net revenue to break even (1 ÷ 0.365). That is your break-even ROAS, and it's why the same 3x ROAS can be profitable for one brand and loss-making for another. Break-even ROAS covers the full calculation, and POAS shows a way to measure campaigns on profit directly.
| CM2 margin | Break-even ROAS | ROAS needed for 10% CM3 |
|---|---|---|
| 30% | 3.33x | 5.00x |
| 36.5% | 2.74x | 3.77x |
| 45% | 2.22x | 2.86x |
| 55% | 1.82x | 2.22x |
Improving each level
- CM1: raise prices, bundle products, negotiate supplier costs, push higher-margin products in ads.
- CM2: cut RTO with prepaid nudges and order confirmation, negotiate courier rates, right-size packaging.
- CM3: cut loss-making campaigns, refresh tired creatives, move budget to campaigns with the best profit after returns.
Most brands find the fastest gains in CM2, because RTO and shipping are large and often unmanaged.
Common mistakes
Using gross revenue. Revenue before discounts, GST and cancellations overstates every level. Start from net revenue.
Forgetting RTO. Returned COD orders often sit outside the profit sheet because they never became revenue. But they still cost shipping both ways and packaging. Put the cost in CM2.
Mixing months. Counting RTO in the month the parcel came back, rather than the month it was sold, makes a strong month look worse and a weak month look better. Attribute it to the order's month.
Leaving out payment fees. Gateway and COD fees look small per order, often 2% or a fixed ₹30 to ₹40, but they add up across thousands of orders.
Average product cost. Using one blended cost for every product hides the products that lose money. Use cost per variant where you can.
Treating marketing as fixed. Ad spend moves with orders, so it belongs in CM3, not with rent and salaries. Keeping it separate is what lets you see whether growth is profitable.
Contribution margin by product and campaign
A brand-level CM2 can hide products that lose money on every order. Work it out per product too: product cost, the shipping weight band it falls in, and its RTO rate. A heavy, low-priced product with high RTO can have negative CM2 even when the brand average looks healthy. Do the same by campaign for CM3, using each campaign's kept orders and spend, and you'll see which campaigns pay for themselves and which ride on the others.
Tera Ads shows profit after ad spend and returns on one screen, from your Shopify orders, your Meta Ads and Google Ads spend, and RTO from Shiprocket, free for one business.
Frequently asked questions
What is a good contribution margin for a D2C brand?
It depends on category and stage. What matters is that CM3 is positive and large enough to cover fixed costs. Track the trend month by month rather than comparing with other brands.
Is contribution margin the same as gross margin?
No. Gross margin is revenue minus product cost (roughly CM1). Contribution margin goes further, taking off the variable costs of each order and, at CM3, marketing.
Should discounts be counted as marketing?
Use net revenue after discounts for CM1. Some teams count promotional discounts as a marketing cost in CM3 instead; either works if you're consistent.
Do I include GST in revenue?
No. Use revenue net of GST, because the tax isn't yours to keep.
How often should I calculate contribution margin?
Monthly at minimum, and weekly for CM3 if you spend heavily on ads, because that's the level that changes fastest.