POAS (Profit on Ad Spend): The Metric That Replaces ROAS
POAS divides the profit an ad brought by what it cost. How to calculate it, why break-even is always 1.0, and why it ranks campaigns differently from ROAS.
On this page
POAS, profit on ad spend, is the profit a campaign brought in divided by what the campaign cost. Where ROAS uses revenue, POAS uses gross profit after product cost and the costs of fulfilling the order, so break-even is always 1.0 whatever your margins. A POAS of 1.4 means every ₹1 of ads returned ₹1.40 of profit, or ₹0.40 more than it cost. It ranks campaigns by what you keep.
Key takeaways
- POAS = gross profit from attributed orders ÷ ad spend. Break-even is 1.0.
- ROAS treats a ₹1,000 sale of a 20% margin product the same as one at 70%; POAS doesn't.
- Use profit after product cost, shipping, fees and returns, not just revenue minus product cost.
- Two campaigns with the same ROAS can have very different POAS when they sell different products.
- POAS needs product costs per item, so keep costs up to date in Shopify.
The formula
POAS = (revenue − product cost − shipping − fees − returns and RTO) from the orders a campaign brought in ÷ that campaign's ad spend.
The top line is the same contribution margin before marketing that contribution margin calls CM2. Dividing it by ad spend tells you how many rupees of profit each rupee of ads produced.
| POAS | What it means |
|---|---|
| Below 1.0 | The campaign costs more than the profit it brings: losing money |
| 1.0 | Break-even: profit exactly pays for the ads |
| 1.0 to 1.3 | Small profit; fine for acquiring customers who come back |
| Above 1.3 | Clearly profitable; a candidate for more budget |
Why POAS ranks campaigns differently
ROAS rewards revenue. A campaign selling a ₹1,000 product with a 20% margin and one selling a ₹1,000 product with a 60% margin can show the same ROAS, but one makes three times the profit.
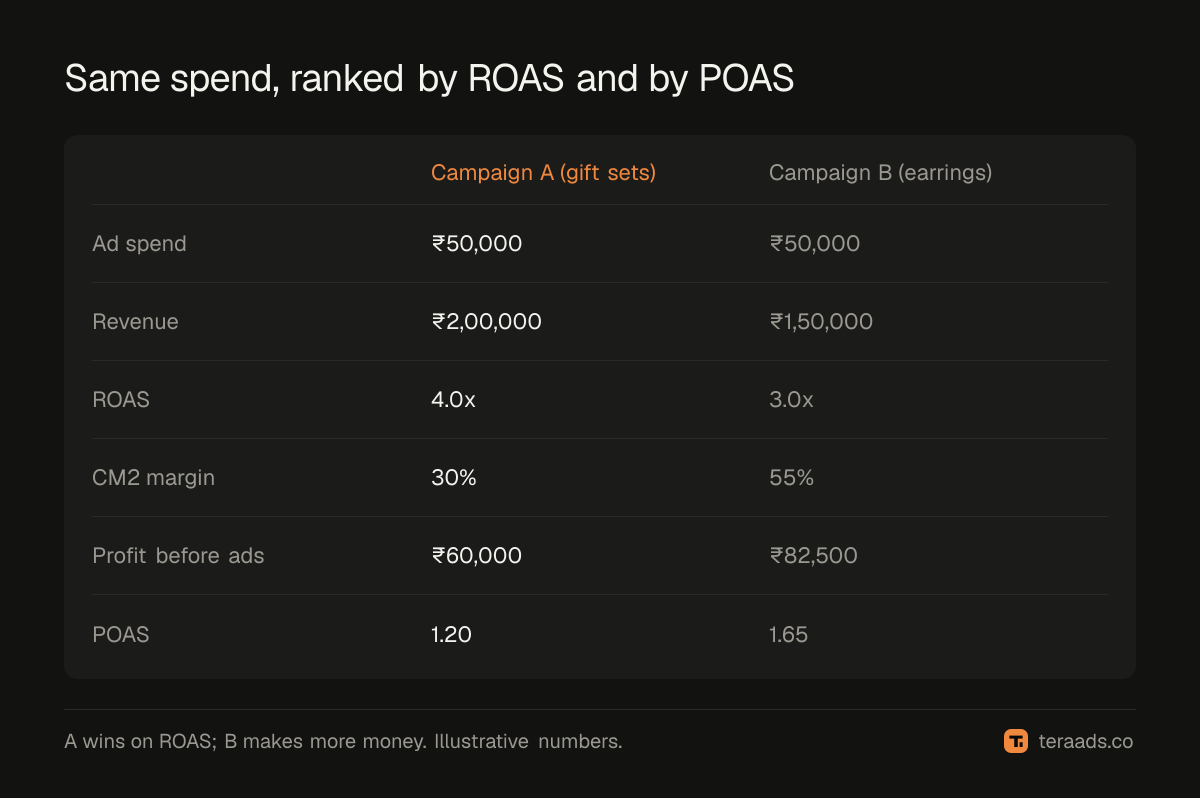
Illustrative example, both campaigns spending ₹50,000:
- Campaign A sells mostly gift sets with 30% CM2. Revenue ₹2,00,000. ROAS 4.0. Profit ₹60,000. POAS 1.2.
- Campaign B sells mostly silver earrings with 55% CM2. Revenue ₹1,50,000. ROAS 3.0. Profit ₹82,500. POAS 1.65.
By ROAS, A wins. By POAS, B wins, and B is the one making more money.
POAS and RTO
For Indian brands with cash-on-delivery orders, returns change POAS even more than ROAS. A returned COD order brings no revenue but still costs shipping both ways. If you use revenue from Ads Manager, which counts orders before they're returned, both ROAS and POAS look too good. Use kept orders from Shopify and RTO outcomes from your courier. True ROAS after RTO and COD explains the adjustment.
POAS vs ROAS vs break-even ROAS
| Metric | Formula | Break-even | Best for |
|---|---|---|---|
| ROAS | Revenue ÷ ad spend | Depends on margin (1 ÷ CM2 %) | Quick platform-level reads |
| Break-even ROAS | 1 ÷ CM2 as a share of revenue | Is the threshold | Turning ROAS into a profit test |
| POAS | Gross profit ÷ ad spend | Always 1.0 | Comparing campaigns with different products and margins |
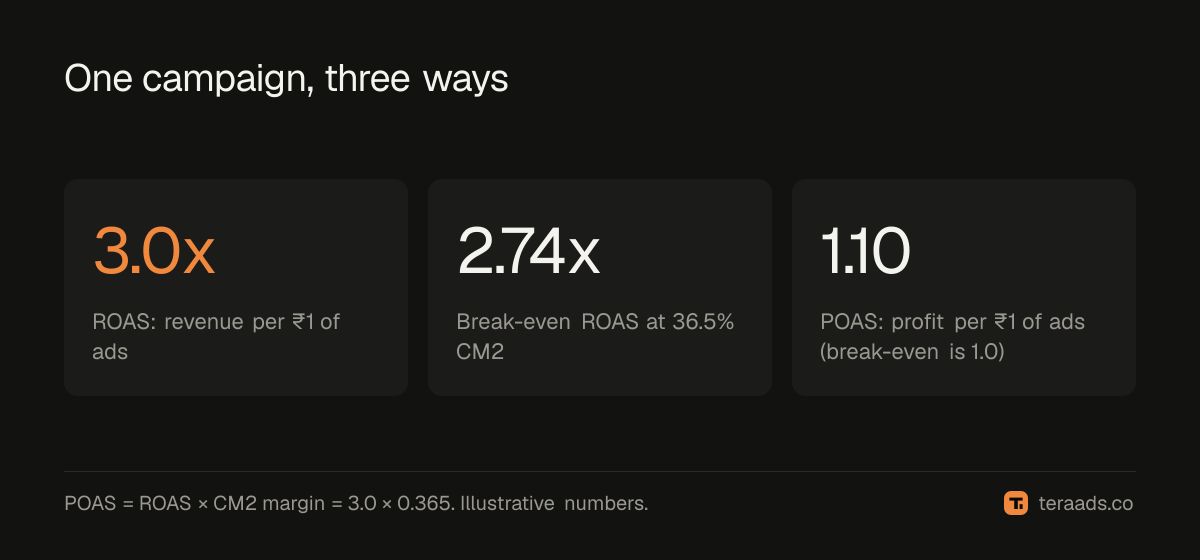
If every campaign sells the same mix of products, ROAS checked against break-even ROAS gives the same answer as POAS. When campaigns sell different products with different margins, POAS is the honest comparison.
How to calculate POAS for your campaigns
- Put product costs in Shopify. Every variant needs a cost per item, or profit can't be calculated.
- Attribute orders to campaigns. Use UTM parameters on every ad link so Shopify orders carry the campaign; see UTM parameters for Shopify.
- Work out profit per order. Revenue minus product cost, shipping, payment fees and packaging.
- Remove returned and RTO orders. Take out their revenue and add the cost of the return.
- Divide by ad spend. Profit from each campaign's kept orders ÷ that campaign's spend.
Do it weekly, on a window old enough for most deliveries to settle, usually orders at least 10 to 14 days old.
Can you bid on POAS?
Ad platforms optimise toward the conversion value you send them. If you send profit instead of revenue as the purchase value, the platform's ROAS bidding becomes POAS bidding. This can work well but needs care: it changes reporting, can break comparisons with past data, and needs accurate costs per product. Most brands start by reporting on POAS before bidding on it.
Common mistakes with POAS
Using revenue minus product cost only. That's CM1, not the profit that pays for ads. Leave out shipping, fees and returns and POAS looks better than it is.
Using platform-reported revenue. Meta and Google count orders before cancellations and RTO. Use kept Shopify orders.
Judging too early. A week-old order may still come back as RTO. Calculate POAS on orders old enough for most deliveries to settle.
Ignoring repeat purchase. A prospecting campaign with POAS slightly below 1.0 can still be worth running if the customers it finds come back. Judge prospecting on first-order POAS and repeat value together; the blended CAC guide covers payback.
Out-of-date costs. Supplier prices change. A cost per item that's a year old makes every POAS number wrong.
POAS for prospecting and retargeting
Retargeting usually shows a higher POAS because it reaches people already close to buying, and some of them would have bought anyway. Prospecting shows a lower POAS but finds new customers. Compare each against its own target rather than against each other, and don't move all budget to retargeting because its POAS looks best; the pool of warm visitors shrinks without prospecting to refill it.
Tera Ads shows profit after ad spend and returns on one screen, from your Shopify orders, your Meta Ads and Google Ads spend, and RTO from Shiprocket, with every campaign from both platforms in one table. It is free for one business.
Frequently asked questions
What is a good POAS?
Above 1.0 means the campaign is profitable. Many brands look for 1.2 to 1.5 on prospecting, and higher on retargeting. Set your own target from fixed costs and how much repeat purchase you expect.
Is POAS better than ROAS?
For decisions about profit, yes, because it accounts for different margins. ROAS is still useful for quick reads inside ad platforms, especially when you know your break-even ROAS.
Why is break-even POAS always 1.0?
Because POAS already uses profit. When profit equals ad spend, you've exactly paid for the ads, whatever your margin.
Do I need special software for POAS?
No. A spreadsheet with Shopify orders, product costs and ad spend by campaign works. The hard part is keeping it updated weekly as returns come in.
Does POAS include fixed costs?
No. Like contribution margin, it covers the costs each order causes. Fixed costs such as salaries and rent come out of the total profit afterwards.