Break-Even ROAS: The Formula, With RTO and a Worked Example
Break-even ROAS is 1 divided by your margin, but only if the margin is honest. The formula with shipping, payment fees and RTO, worked through in rupees.
On this page
Break-even ROAS is the return on ad spend at which an ad campaign neither makes nor loses money: 1 divided by your contribution margin as a share of revenue. With a 40% margin, break-even ROAS is 2.5x. The catch is the margin: it must include product cost, shipping, payment fees, GST and returns. For Indian brands with cash-on-delivery orders, RTO usually pushes break-even ROAS well above what people expect.
Key takeaways
- Break-even ROAS = 1 ÷ contribution margin (as a decimal). A 50% margin means 2x.
- Use contribution margin after product cost, shipping, payment fees and RTO, not gross margin.
- RTO raises break-even ROAS twice: it lowers revenue kept and adds return freight.
- Compare break-even ROAS with true ROAS (after returns), not with Ads Manager ROAS.
- Your target ROAS should sit above break-even by the profit you want, or below it on purpose when buying new customers.
The formula
Return on ad spend is revenue divided by ad spend. A campaign breaks even when the margin it earns on that revenue exactly pays for the ads:
Revenue × contribution margin = ad spend
Rearranged:
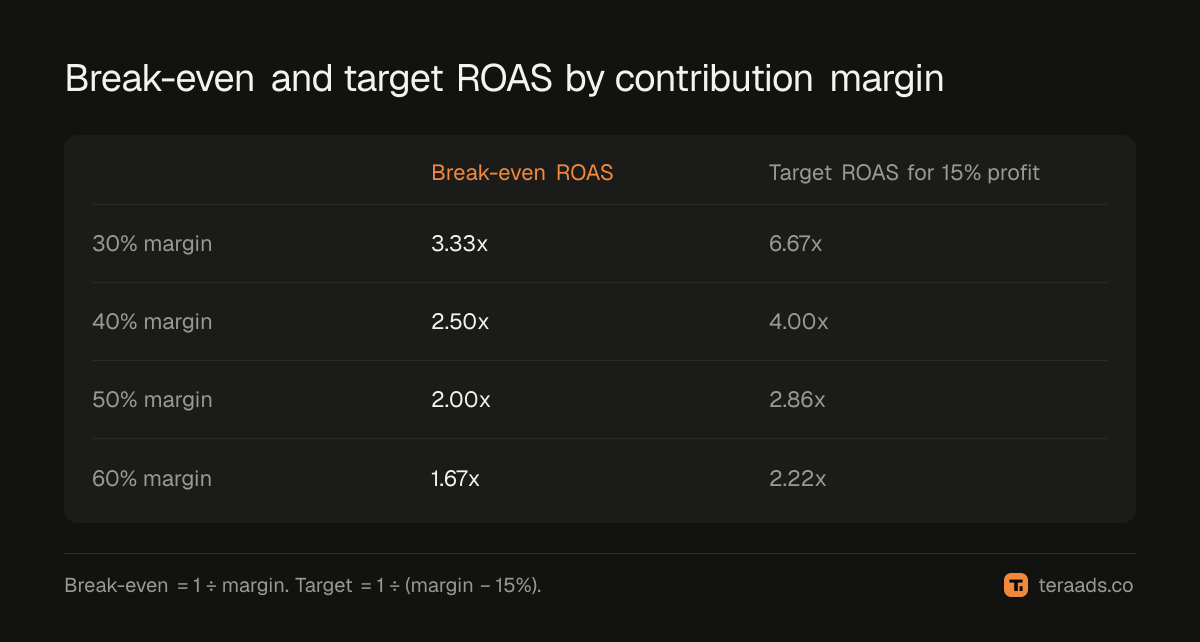
Break-even ROAS = 1 ÷ contribution margin
So a product that leaves 40% of its price after all variable costs breaks even at 1 ÷ 0.40 = 2.5x. Every rupee of ads needs ₹2.50 of revenue to pay for itself.
What goes into contribution margin
Gross margin (price minus product cost) is not enough. Contribution margin takes off every cost that grows with each order:
| Cost per order | Include? | Why |
|---|---|---|
| Product cost (COGS) | Yes | The biggest variable cost |
| Packaging | Yes | Paid on every parcel |
| Forward shipping | Yes | Paid on every shipped order |
| Payment gateway or COD fee | Yes | Usually 2–3% of order value, or a flat COD charge |
| GST on the sale | Yes, take it out of revenue | It is collected for the government, not earned |
| Discounts | Yes | Take them out of revenue |
| RTO (lost revenue and return freight) | Yes | Covered in its own section below |
| Rent, salaries, software | No | Fixed costs: they don't change with one more order |
Fixed costs matter for the business, but they don't belong in break-even ROAS. They are what your total contribution, across all orders, has to cover each month.
A worked example in rupees
The numbers here are an illustration. A product sells for ₹1,180 including 18% GST:
- Revenue after GST: ₹1,000
- Product cost: ₹300
- Packaging: ₹30
- Forward shipping: ₹70
- Payment and COD fees: ₹25
Contribution margin before returns: ₹575, or 57.5%. Break-even ROAS before returns: 1 ÷ 0.575 = 1.74x.
That looks comfortable. Now add returns.
How RTO changes break-even ROAS
Suppose 60% of orders are cash on delivery with 25% RTO, and prepaid RTO is 2%. Blended, about 16% of shipped orders come back. On each of those:
- You lose the ₹1,000 of revenue.
- You still paid packaging and forward shipping (₹100), and you pay ₹70 of return freight.
- The product comes back, so product cost is not lost (unless it is damaged).
Per 100 orders shipped, with these numbers:
- 84 delivered orders earn 84 × ₹575 = ₹48,300 of margin.
- 16 RTOs cost 16 × ₹170 = ₹2,720 in freight and packaging.
- Net contribution: ₹45,580 on revenue kept of ₹84,000.
But the ad platform counts all 100 orders, ₹1,00,000 of revenue. So measured against what Ads Manager reports, your margin is ₹45,580 ÷ ₹1,00,000 = 45.6%, and break-even platform ROAS is 1 ÷ 0.456 = 2.19x, not 1.74x.
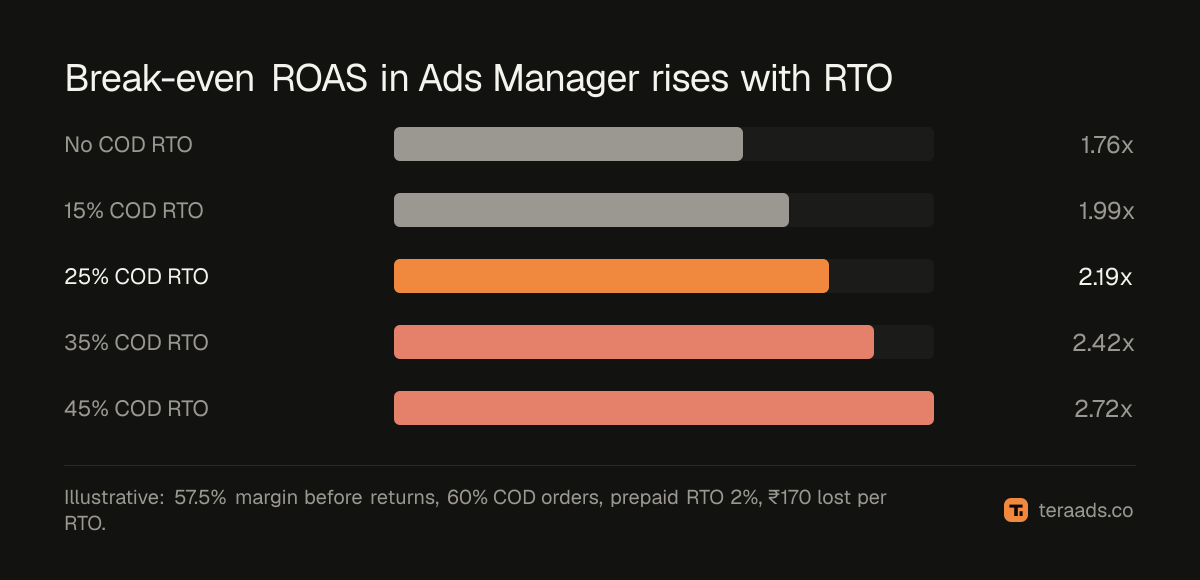
At 35% COD RTO the break-even platform ROAS in this example rises to about 2.4x. A campaign that reports 2.3x in Ads Manager can look profitable while losing money on every rupee.
Two ways to use the number
There are two consistent ways to compare, and mixing them is the most common mistake:
- True ROAS vs margin on kept orders. Measure ROAS on delivered, kept revenue, as explained in true ROAS after RTO and COD, and compare it with break-even using the margin on delivered orders minus RTO freight.
- Platform ROAS vs margin on attributed revenue. If your team lives in Ads Manager, use the RTO-adjusted break-even above (2.19x in the example) as the floor.
Either works. Comparing Ads Manager ROAS with a margin that ignores returns does not.
From break-even to target ROAS
Break-even is the floor, not the goal. A target ROAS adds the profit you want from each rupee of ads:
Target ROAS = 1 ÷ (contribution margin − desired profit margin)
With a 45.6% RTO-adjusted margin and a goal of 15% profit on revenue, target ROAS = 1 ÷ (0.456 − 0.15) = 3.27x.
There are good reasons to run some campaigns below break-even on purpose. Prospecting campaigns that win first orders from customers who come back often can lose money on the first order and still be profitable over the customer's lifetime. If you do this, decide the allowed loss in advance and measure repeat purchases, so a "customer acquisition" campaign doesn't become a polite name for a losing one.
For the account as a whole, many brands set budget against MER instead of ROAS, which avoids attribution arguments between Meta, Google and Shopify.
How to keep break-even ROAS honest
- Recalculate monthly. Courier rates, COD share, discounts and product costs all move. So does RTO, especially around sale seasons.
- Calculate per product or category if margins differ. A store with 70% margin accessories and 35% margin bestsellers has two very different break-evens.
- Use your real RTO. Borrowed industry averages hide your own problem areas. The RTO cost calculator shows how to get a rupee figure per returned parcel.
- Watch the trend, not one day. Daily ROAS is noisy; judge campaigns on a week or more of spend.
Tera Ads shows profit after ad spend and returns on one screen, from your Shopify orders, your Meta Ads and Google Ads spend, and RTO from Shiprocket, free for one business. That turns break-even ROAS from a spreadsheet exercise into a number you can check every morning.
Frequently asked questions
What is a good ROAS for an Indian D2C brand?
Any ROAS above your break-even is profitable, so it depends on your margin and RTO. A brand with high margins and mostly prepaid orders may do well at 2x; a low-margin, COD-heavy brand may need 3x or more in Ads Manager.
Is break-even ROAS the same as target ROAS?
No. Break-even is the point of zero profit. Target ROAS is break-even plus the profit you want, and it is the number to give your team or to use in value-based bidding.
Should I include GST in revenue when calculating ROAS?
Be consistent. Revenue should exclude the GST you collect for the government. If you claim input credit on the GST charged on ad spend, use ad spend without GST; if you can't claim it, include it.
Does break-even ROAS change during sale seasons?
Yes. Discounts lower your margin, so break-even ROAS rises exactly when ad costs also rise. Recalculate it with sale prices before the season starts.
Why is my ROAS high but my profit low?
Usually because ROAS is measured on placed orders while profit depends on delivered ones. High RTO, heavy discounts or Meta and Google both claiming the same sale can all make ROAS look better than the business is.