Spreadsheet vs Dashboard for Ads Reporting: When to Switch
Spreadsheets are free and flexible; dashboards are fast and consistent. The real costs of each for a D2C brand, the signs you've outgrown a sheet, and how to switch.
On this page
A spreadsheet is the right tool for ads reporting while you have a few campaigns, one person updating it and weekly decisions; a dashboard becomes better when the weekly refresh takes hours, errors creep in or you need daily numbers. The deciding cost isn't the software price but the time spent exporting, pasting and checking, and the decisions delayed while you do it. Keep the sheet's honest logic when you switch.
Key takeaways
- Spreadsheets cost nothing to start but cost time every week.
- Dashboards cost setup or subscription but refresh themselves and look the same every time.
- Switch when refresh takes more than an hour a week, numbers disagree, or decisions wait for the sheet.
- Whatever you use, revenue should come from Shopify and profit should include returns.
- A good dashboard should reproduce your sheet's key numbers before you trust it.
The real comparison
| Spreadsheet | Dashboard | |
|---|---|---|
| Upfront cost | Free | Free to expensive, depending on the tool |
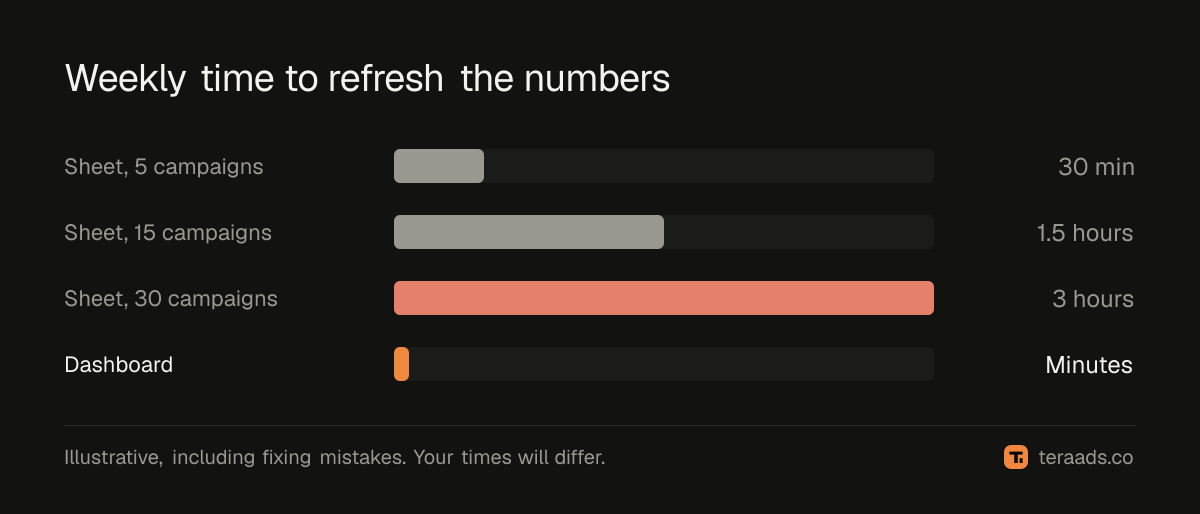
| Weekly time | 30 minutes to several hours | Minutes |
| Freshness | As fresh as your last export | Daily or more often |
| Flexibility | Anything you can write a formula for | What the tool offers |
| Error risk | Broken formulas, pasted ranges, mismatched names | Wrong setup, unclear definitions |
| Consistency | Varies by who updates it | Same calculation every time |
| Sharing | Easy, but versions multiply | One link, one version |
When a spreadsheet is the better choice
- You run fewer than ten campaigns across Meta and Google.
- One person owns the sheet and updates it on the same day each week.
- You make budget decisions weekly, not daily.
- You need a custom calculation no tool offers.
- You're still working out which numbers matter; a sheet is the cheapest place to experiment.
The Google Sheets ads dashboard guide shows a structure that works.
Signs you've outgrown it
- The refresh takes over an hour. Time spent pasting is time not spent deciding.
- Numbers disagree. Two people's versions show different totals.
- Decisions wait. Budget changes are delayed until "the sheet is updated".
- Errors surface late. A formula broke three weeks ago and nobody noticed.
- You need daily numbers. During a sale, weekly data is too slow.
- More people need it. Founders, agencies and team members each ask for their own cut.
What a dashboard should do
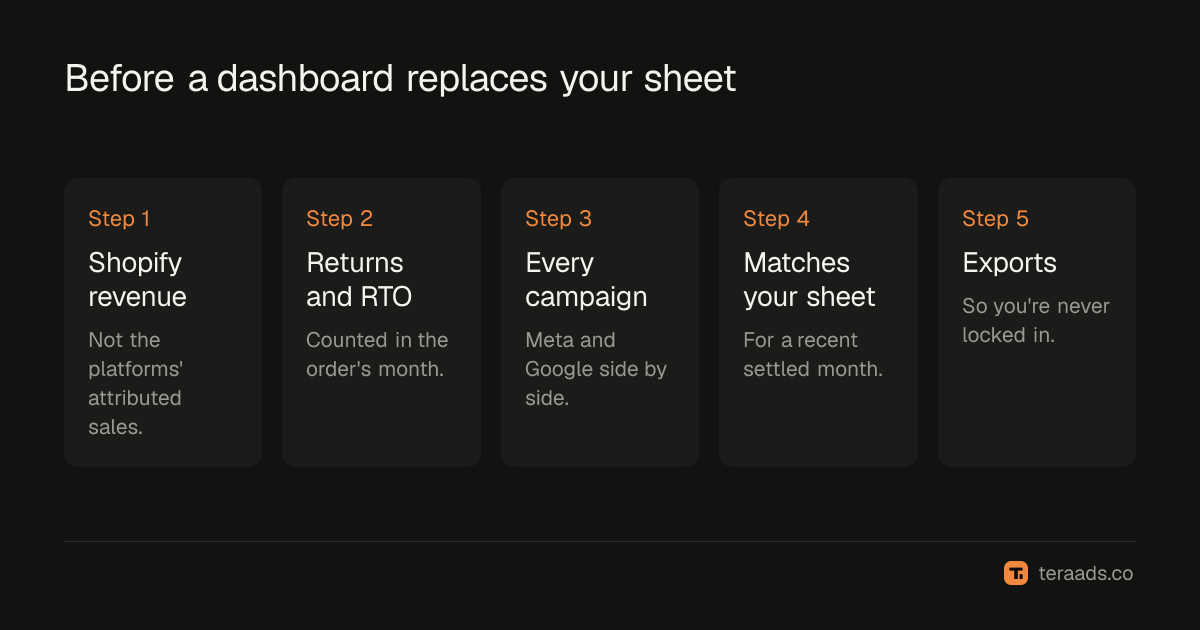
A dashboard is only better if it calculates the right things. Before switching, check that it:
- Uses Shopify orders as revenue, not the ad platforms' attributed sales.
- Includes returns and RTO, counted in the month the order was placed.
- Shows every Meta and Google campaign side by side.
- Matches your sheet for a recent settled month, within a small margin.
- Lets you export the data, so you're not locked in.
Shopify profit tracking lists what the profit calculation should include.
Switching without losing what worked
Run both for a month. Each week, compare the dashboard's spend, revenue, MER and campaign ROAS with your sheet. Investigate every difference larger than a few per cent; usually it's a definition, such as which orders count or how refunds are handled. Once they agree, retire the weekly refresh but keep the sheet for one-off analysis that the dashboard doesn't cover.
The hidden cost of "free"
A founder spending two hours a week on a reporting sheet spends over a hundred hours a year on it. Valued at even ₹1,000 an hour, that's more than ₹1 lakh of time, before counting decisions made late or on wrong numbers. That doesn't mean every brand needs a paid tool; it means the time should be counted when you compare options. A free ads dashboard can remove most of the time without adding cost.
A middle path
You don't have to choose all at once. Many brands keep a sheet but cut the manual work: scheduled reports from Meta and Google, a Shopify export saved to the same folder each week, and a sheet that reads from those files. Others use a free dashboard for the weekly numbers and keep the sheet for questions it can't answer, such as a one-off analysis of a festive sale or a pricing test. Whatever mix you choose, keep one definition of revenue (Shopify orders), one of spend (the ad platforms) and one of returns (your courier), so numbers agree wherever they appear.
Keeping the sheet honest
If you keep the sheet, protect it. Lock the formula cells, keep raw exports on separate tabs that are pasted over, never edited, and add a check cell that compares total spend with the ad platforms' own totals for the same dates. When the check turns red, stop and fix it before anyone reads the summary.
Questions to ask yourself
- How long did last week's refresh take, honestly, including fixing mistakes?
- When did someone last find an error in the sheet, and how long had it been wrong?
- Did any budget decision wait for the sheet to be updated?
- Does everyone who needs the numbers look at the same version?
- Could someone else update it if the usual person were away?
- Is RTO included, or are campaigns still judged on orders that may come back?
If most answers point to lost time, errors or delays, the sheet costs more than it saves. If the refresh is quick, the numbers are trusted and decisions don't wait, keep it; there's no prize for switching early. Revisit the choice every six months as campaigns and the team grow.
Common mistakes
Switching without checking the numbers. Run both until they agree.
Keeping two sources of truth. Once switched, decide which one the team uses.
Choosing a tool without returns. For COD brands, profit without RTO is overstated.
Rebuilding every custom metric. Keep the sheet for rare analysis; use the dashboard for the weekly numbers.
Ignoring time cost. Count the hours, not just the subscription.
Tera Ads is a dashboard built around these checks: Shopify sales, Meta Ads and Google Ads spend, and profit after RTO from Shiprocket, with every campaign in one table. It is free for one business.
Frequently asked questions
Is a spreadsheet good enough for ads reporting?
Yes, for a few campaigns, one owner and weekly decisions. It becomes costly as campaigns, people and the need for daily numbers grow.
When should I switch from Excel to a dashboard?
When the weekly refresh takes over an hour, versions disagree, decisions wait for the update, or you need daily numbers.
Are dashboards more accurate than spreadsheets?
Only if they're set up with the right definitions. Check a dashboard against your sheet for a settled month before trusting it.
Can I use both a spreadsheet and a dashboard?
Yes. Many brands use a dashboard for weekly numbers and a spreadsheet for one-off analysis.
What should an ads dashboard include?
Shopify revenue, total ad spend, MER, every campaign from Meta and Google, and profit after returns.