Using AI to Analyse Shopify Profit: Products, Discounts and Returns
Claude or ChatGPT can work out profit by product, discount and payment method from your Shopify exports. What to export, what to ask, and how to check the numbers.
On this page
AI assistants can turn Shopify order exports into a profit analysis in minutes: profit by product, by discount code, by payment method and after returns. Export orders and product costs, remove customer details, give Claude or ChatGPT your shipping, fee and return costs, and ask it to calculate contribution per order. Check one product by hand, then use the results to fix prices, discounts and the products you advertise.
Key takeaways
- Shopify knows revenue; profit needs product costs, shipping, fees and returns added.
- Export orders with line items, discount codes and payment method, plus a product cost sheet.
- Ask for contribution per order and per product, not just revenue rankings.
- Returns and refused COD orders change which products are profitable; include them.
- Check one product's numbers by hand before changing prices or ads.
Why revenue reports aren't enough
Shopify's reports show which products sell most and bring the most revenue. They don't tell you which ones make money once you subtract product cost, shipping both ways, payment fees, packaging and the cost of orders that come back. A best-seller with thin margins and a high refusal rate can lose money on every ad-driven sale. Shopify profit tracking covers the full picture; AI makes the calculation quick.
What to export
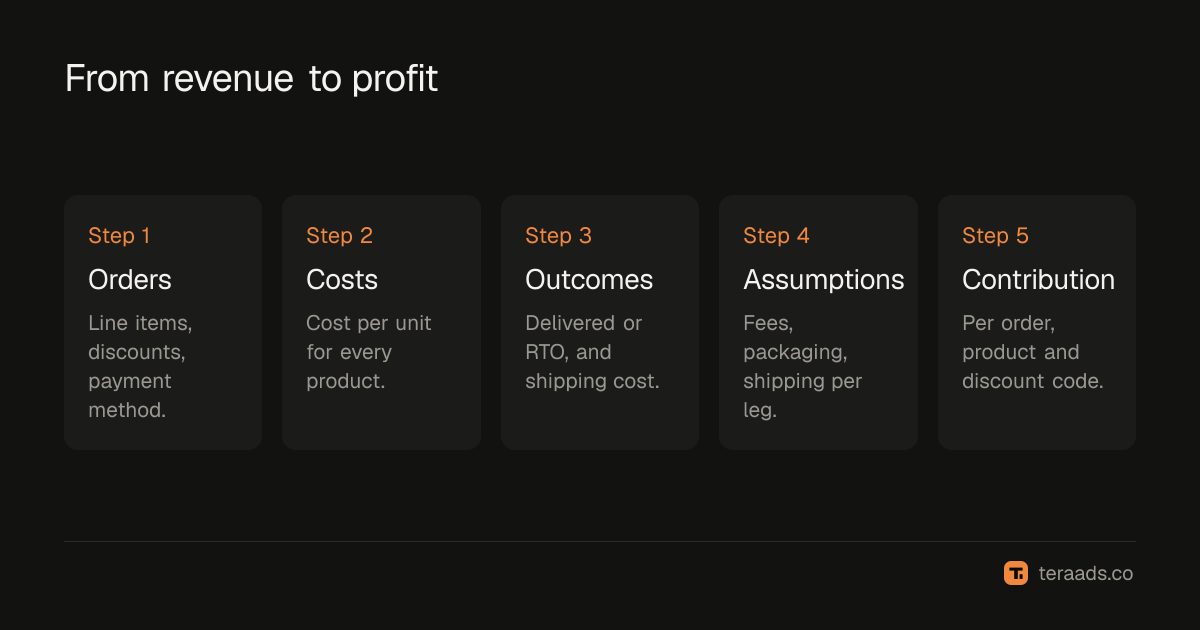
| File | Where | Columns that matter |
|---|---|---|
| Orders with line items | Shopify orders export | Order number, date, product, variant, quantity, price, discount code, discount amount, shipping charged, payment method, status |
| Product costs | Your own sheet, or the cost per item field in Shopify | Product or SKU, cost per unit |
| Shipment outcomes | Your shipping platform | Order number, final status, shipping cost |
| Fixed assumptions | Write them in the prompt | Payment fee %, packaging per order, shipping per leg |
Remove customer names, emails, phones and addresses before uploading. Order numbers are enough to join files.
The prompt
Using the uploaded files, calculate contribution for each order: item revenue after discounts, plus shipping charged, minus product cost, payment fee at [x]%, packaging at ₹[y], and shipping at ₹[z] per leg. For RTO orders, revenue is zero and shipping is charged both ways. Then show, as tables: contribution by product, by discount code and by payment method, with order counts. State any rows you couldn't match.
The calculation follows the contribution margin approach: what each order leaves after the costs it causes.
Questions to ask next
- "Which ten products bring the most contribution in total? Which bring the most per order?"
- "Which products have contribution below ₹100 per kept order?"
- "What does each discount code cost in total, and how does order contribution compare with and without a code?"
- "Compare COD and prepaid orders: average order value, RTO rate and contribution per order placed."
- "Which products appear most often in refused COD orders?"
- "If we raised the free shipping threshold to ₹[x], how many past orders would have been below it?"
For ad questions, combine this with Meta and Google exports; the prompt library for ads analysis has prompts that join orders to campaigns.
A worked example
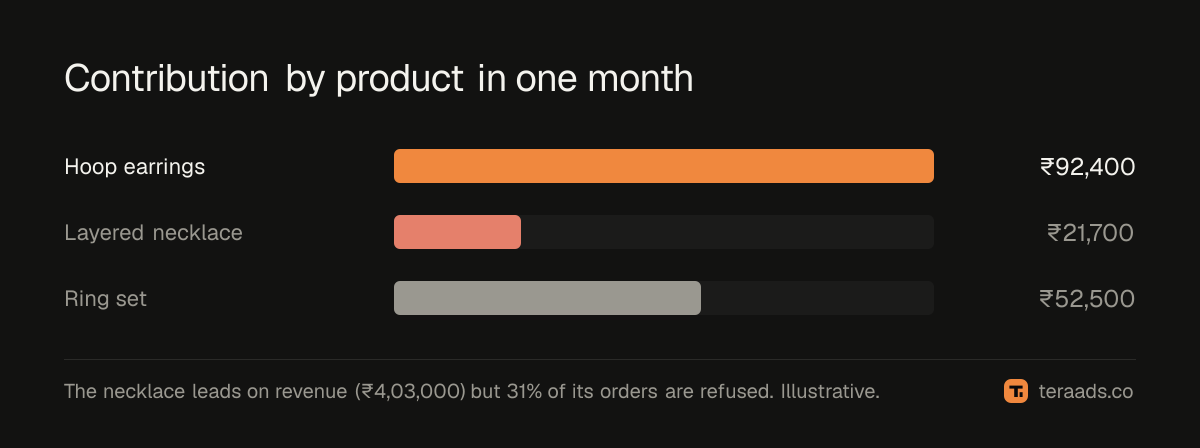
An illustrative store runs this analysis on one month and finds:
| Product | Orders | Revenue | RTO rate | Contribution |
|---|---|---|---|---|
| Hoop earrings | 420 | ₹3,78,000 | 18% | ₹92,400 |
| Layered necklace | 310 | ₹4,03,000 | 31% | ₹21,700 |
| Ring set | 150 | ₹1,65,000 | 12% | ₹52,500 |
The necklace brings the most revenue but the least contribution, because nearly a third of its COD orders are refused and each refusal costs two shipping legs. The store's ads were weighted toward the necklace because Meta reported it as the top seller. The fix: advertise the hoops and ring set more, and offer a prepaid discount on the necklace.
Checking the numbers
- Reconcile revenue. Total item revenue in the analysis should match Shopify's sales report for the period, before returns.
- Recalculate one product. Take one product's orders and work out contribution yourself in a spreadsheet.
- Check unmatched rows. Orders without a cost or a shipment outcome distort results; ask the assistant to list them.
- Look at the date range. Use orders old enough for returns to settle, usually three weeks or more.
Shopify's own tools
Shopify's built-in assistant, Sidekick, can answer questions about your store's reports inside the admin, and the cost per item field lets Shopify show gross profit in some reports. For profit after shipping, fees and returns, and for joining delivery outcomes, an export analysed this way is still the most complete approach.
Turning findings into decisions
An analysis is only useful if something changes. The most common decisions it supports:
- Which products to advertise. Put ad budget behind products with high contribution per kept order, not the highest revenue. A product that leaves ₹350 per order can afford a much higher cost per purchase than one that leaves ₹70.
- Which discounts to keep. If a code is used mostly by customers who would have bought anyway, or pushes orders below a sensible margin, retire it or raise its minimum order value.
- Prices and bundles. Products with thin contribution may need a price rise, a cheaper shipping option or a bundle that raises order value.
- Payment options. If COD orders for certain products are refused far more often, a prepaid discount or a partial advance on those products protects contribution.
Run the same analysis every month with the same prompt, so you can see whether a change worked. Keep the prompt and assumptions in one document, and update shipping and fee rates when they change, otherwise month-to-month comparisons drift.
Common mistakes
Ranking by revenue. Revenue leaders are often not profit leaders.
Leaving out returns. RTO changes which products make money, especially for COD stores.
Missing product costs. Products without costs look like pure profit; fill them in first.
Uploading customer details. They're not needed; remove them.
Acting without a hand check. Recalculate one product before changing prices or ads.
Tera Ads works out profit after product costs, shipping and returns from your Shopify orders automatically, and puts Meta Ads and Google Ads spend beside it. It is free for one business.
Frequently asked questions
Can ChatGPT analyse Shopify sales data?
Yes. Export orders with line items, remove customer details, upload the file with your product costs and ask for calculations.
How do I calculate profit per product on Shopify?
Subtract product cost, shipping, payment fees, packaging and the cost of returns from each product's revenue after discounts.
Does Shopify show profit?
Shopify can show gross profit when you enter a cost per item, but it doesn't include shipping, fees or returns by default.
Should I include RTO in product profit?
Yes. Refused COD orders bring no revenue and cost shipping both ways, so they can turn a best-seller unprofitable.
Is it safe to upload Shopify orders to an AI assistant?
Remove customer names, emails, phones and addresses first. Order numbers, products and amounts are enough.