A Weekly Ads Report With AI: Template, Prompts and Checks
Build a 15-minute weekly ads report with Claude or ChatGPT: what data to pull, a reusable prompt, the sections to include and the checks that keep it honest.
On this page
A good weekly ads report answers three questions: did ads make money, what changed and why, and what to do next week. Pull the same exports every week from Meta Ads, Google Ads and Shopify, paste them into Claude or ChatGPT with a fixed prompt, and get a one-page report with totals, changes, causes and up to three actions. Check the totals against the platforms before sharing it, and keep each week's report so trends are easy to see.
Key takeaways
- Use the same data, the same prompt and the same layout every week, so weeks are comparable.
- Lead with business results: total ad spend, Shopify revenue, MER and profit after returns.
- Explain changes with evidence: CPM, CTR, conversion rate and returns.
- Limit actions to three, each with an owner and a way to measure it.
- Reconcile totals with the platforms before anyone acts on the report.
The data to pull each week
| Source | Export | Period |
|---|---|---|
| Meta Ads Manager | Campaign and ad level: spend, impressions, clicks, purchases, purchase value | Last 7 days and the 7 before |
| Google Ads | Campaign report and search terms: cost, clicks, conversions, value | Same |
| Shopify | Orders: date, total, payment method, UTM source and campaign, status | Same |
| Shipping platform | Shipments with final status, for orders old enough to settle | Orders from 3–5 weeks ago |
Returns take weeks to settle, so the RTO section always looks at an older cohort of orders, not last week's.
Building the report, step by step
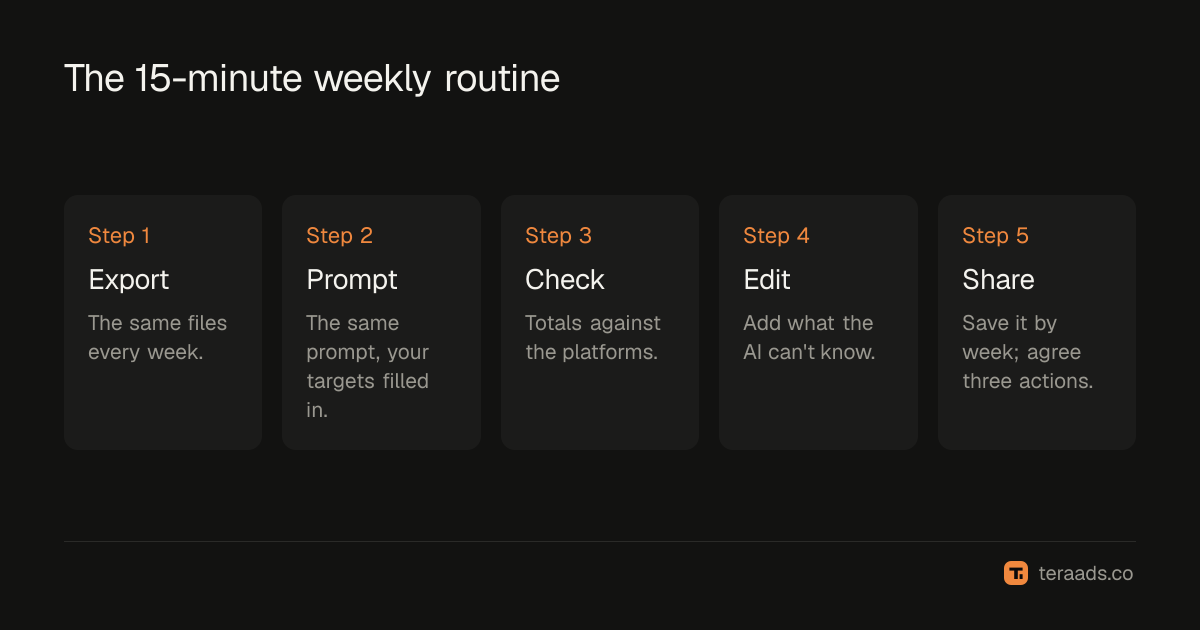
- Export the files above, with customer names, phones and addresses removed.
- Open a new conversation in Claude or ChatGPT, upload the files and say what each one is.
- Paste the fixed prompt below, with your break-even ROAS and RTO rate filled in.
- Check the totals. Compare spend and revenue in the report with Ads Manager, Google Ads and Shopify for the same dates.
- Edit the actions. Keep the ones you agree with, add context the AI can't know, such as stock or a planned sale.
- Save and share. Store each report in one folder or document, named by week.
The fixed prompt
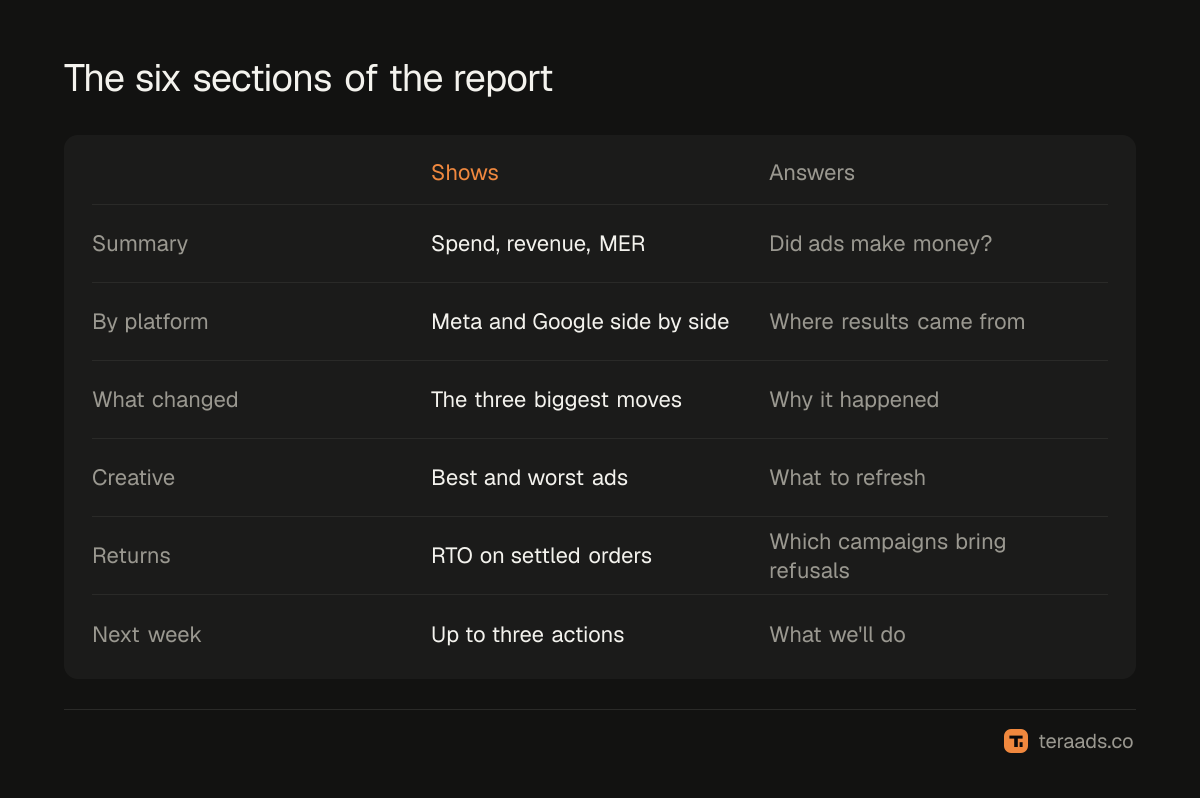
You're preparing our weekly ads report. Break-even ROAS on kept orders is [x]. Our COD RTO rate is around [y]%. Money is in INR. Using only the uploaded files, write a one-page report with these sections: 1. Summary: total ad spend, Shopify revenue, MER, new customers and cost per new customer, this week against last week, as a table. 2. By platform: Meta and Google spend, platform ROAS, and Shopify revenue from UTM-tagged orders for each. 3. What changed: the three biggest changes in spend or results, with the likely cause shown by CPM, CTR or conversion rate. 4. Creative: the top three and bottom three ads by cost per purchase with at least ₹3,000 spend. 5. Returns: RTO rate by campaign for orders placed three to five weeks ago. 6. Next week: up to three actions, each with the evidence and how we'll measure it. State the dates used. If the data can't support a point, say so.
What each section is for
Summary first. Whoever reads the report should know in ten seconds whether ads made money. MER, total revenue divided by total ad spend, is the honest headline because it doesn't depend on any platform's attribution; MER vs ROAS explains why.
Changes with causes. "ROAS fell" isn't useful. "ROAS fell because CPM rose 25% while CTR stayed flat" points at the auction, not the creative. "CTR fell on the two biggest ads" points at fatigue.
Returns from an older cohort. For cash-on-delivery brands, a campaign can look great this week and turn out to have the worst refusals a month later. Reporting RTO on settled orders keeps that visible.
Three actions at most. A report with ten actions gets none done.
Checks before sharing
- Totals match. Spend matches Ads Manager and Google Ads for the same dates; revenue matches Shopify.
- Dates are right. The report states the period, and both weeks are full weeks.
- No invented numbers. Every figure in the text appears in a table or can be traced to a file.
- Actions have evidence. Each recommendation points to a number in the report.
These four checks take five minutes and catch nearly every error. Using ChatGPT for ad analysis lists the common mistakes to look for, and the prompt library has follow-up questions when something in the report needs digging into.
Making it faster
Once the routine is stable, save the prompt as a reusable instruction, such as a Claude project or a custom GPT, so you don't paste it each week. If your assistant is connected to your ad accounts through a connector, it can pull the Meta and Google numbers itself, but Shopify orders and delivery outcomes usually still come from exports.
Sharing the report with a team
If several people read the report, agree who does what with it. The founder or marketing lead reads the summary and approves the actions. Whoever runs the ad accounts owns each action and reports on it the following week. If an agency manages your ads, ask them to use the same format, so their report and yours can be compared line by line. A short call or message thread each week to agree the three actions keeps the report from becoming something people skim and ignore.
Keep a running list of past actions and their results at the bottom of the report. After a couple of months it becomes a record of what works for your account, which is far more useful than any generic benchmark.
Common mistakes
Changing the format every week. Comparisons break and nobody learns the layout.
Leading with platform ROAS. Start with total revenue and spend; platforms overlap and overcount.
Reporting last week's RTO. Returns haven't settled; use an older cohort.
Skipping the reconciliation. One wrong total undermines the whole report.
Too many actions. Three, each with an owner and a measure.
Tera Ads shows total ad spend, Shopify sales and profit after returns for the week on one screen, with every Meta Ads and Google Ads campaign in one table, which makes the reconciliation step quick. It is free for one business.
Frequently asked questions
What should a weekly ads report include?
Total spend, Shopify revenue, MER and new customers; results by platform; what changed and why; best and worst creatives; RTO on settled orders; and up to three actions.
Can ChatGPT or Claude write my weekly ads report?
Yes, from your exports and a fixed prompt. Check the totals against the platforms before sharing.
How long does an AI weekly report take?
Around 15 minutes once the exports and prompt are set up: ten to export and upload, five to check and edit.
Why use MER in a weekly report?
It uses total revenue and total spend, so it doesn't depend on any platform's attribution, and it can't be double counted.
How do I include returns in a weekly report?
Report RTO for orders placed three to five weeks earlier, joined to delivery outcomes from your shipping platform, because recent orders haven't settled yet.