MER vs ROAS: Which Number Should Run Your Ad Budget?
ROAS tells you which ads Meta and Google take credit for. MER tells you whether all your ad spend pays. When to use each, and how to set an MER target.
On this page
MER, the marketing efficiency ratio, is your total store revenue divided by your total ad spend across every channel. ROAS is the revenue one ad platform attributes to its own ads, divided by spend on that platform. Use MER to decide how much to spend overall, because it can't be inflated by attribution. Use ROAS, ideally true ROAS after returns, to decide where inside each platform the money goes.
Key takeaways
- MER = total revenue ÷ total ad spend. No attribution model, no double counting.
- ROAS = platform-attributed revenue ÷ platform spend. Useful for comparing campaigns, unreliable for totals.
- Add Meta ROAS and Google ROAS together and you usually get more revenue than your store took.
- For Indian brands, calculate MER on delivered revenue (after RTO), not on orders placed.
- Run budgets on MER and optimise campaigns on ROAS. They answer different questions.
Two numbers, two questions
| MER | ROAS | |
|---|---|---|
| Formula | Total store revenue ÷ total ad spend | Platform-attributed revenue ÷ platform spend |
| Data source | Shopify (revenue) + all ad invoices | Each ad platform's own reporting |
| Attribution | None needed | The platform's own window and model |
| Double counting | Impossible | Common across platforms |
| Best for | How much to spend in total, month to month | Which campaigns and ads to scale or cut |
| Blind spot | Doesn't say which channel worked | Counts sales the platform didn't cause |
ROAS answers "of the sales Meta thinks it caused, how much did each rupee bring back?" MER answers "for every rupee I spent on ads anywhere, how much came into the store?" Both are useful. They are not interchangeable.
Why platform ROAS adds up to more than you sold
Meta Ads and Google Ads each count a purchase if their ad was clicked or seen inside their attribution window. A customer who clicked a Google Shopping ad on Monday and an Instagram ad on Wednesday, then bought on Thursday, can be counted by both. Meta changed its windows in 2026, removing the 7-day and 28-day view-through options from its reporting API in January (PPC Land), but each platform still sees only its own touchpoints and still claims the sale.
Add the two dashboards together and you often get 120% to 150% of what Shopify recorded. That's not fraud; it is two systems each answering their own question. It becomes a problem when you use the sum to decide total budget. The details of why each platform disagrees with your store are in why Meta Ads and Shopify never agree.
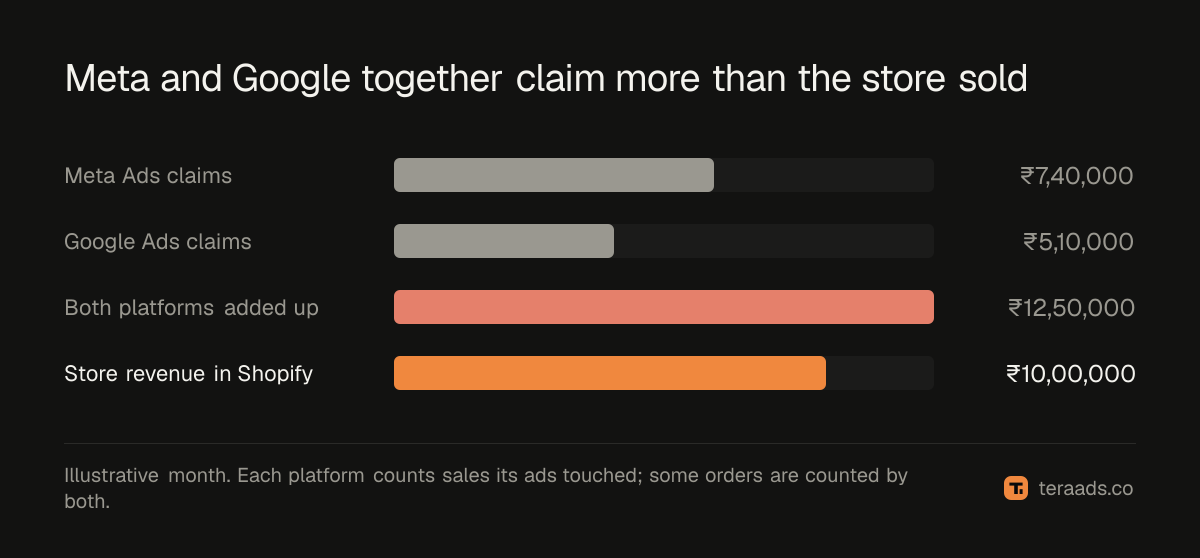
MER sidesteps all of this. Revenue comes from your store, once. Spend comes from your invoices, once. The ratio is crude, and it's also very hard to fool.
How to calculate MER properly
MER = total revenue in the period ÷ total ad spend in the period
Three choices make it honest:
- Which revenue. Use net revenue: after discounts, without GST, and for Indian brands, after RTO and returns. A month with ₹20 lakh of orders and 18% RTO did not earn ₹20 lakh. The method is in true ROAS after RTO and COD; the same adjustment applies to MER.
- Which spend. Every paid channel: Meta, Google, influencer fees, affiliate commissions, marketplace ads if you count marketplace revenue. Leaving a channel out flatters MER.
- Which period. At least a week, better a month. Daily MER jumps around with payday, weekends and sale days.
Some teams use "new-customer MER" (revenue from first orders ÷ ad spend) to stop repeat buyers from hiding weak acquisition. It's worth tracking once you have enough orders to split.
Setting an MER target
Your break-even MER comes from the same logic as break-even ROAS: 1 ÷ contribution margin, using margin after product cost, shipping, payment fees and RTO. With a 45% contribution margin, break-even MER is about 2.2x. If you want 15% of revenue as profit after ads, target MER = 1 ÷ (0.45 − 0.15) = 3.3x.
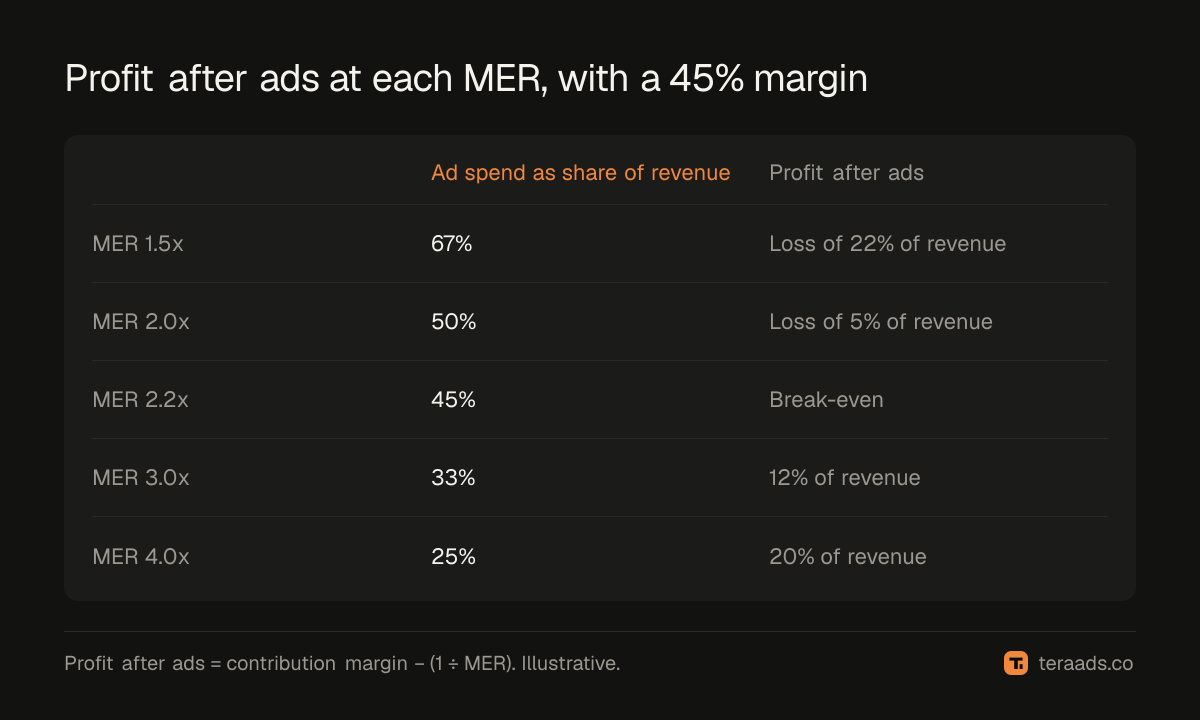
The break-even ROAS guide walks through contribution margin step by step. The point to remember: MER and break-even must use the same definition of revenue. If MER is on delivered revenue, the margin must be on delivered revenue too.
When MER misleads
MER is a total, so it inherits everything that moves your total revenue:
- Organic and repeat sales. A brand with strong word of mouth will have a good MER even if its ads are weak. Track new-customer MER to see through this.
- Seasonality. Diwali lifts revenue across the board; MER rises without the ads getting better.
- Lag. Spend today can bring sales next week. Short windows make MER swing.
- Non-ad marketing. A viral reel or a press mention lifts revenue with no ad cost.
None of these make MER wrong. They mean MER is the number for setting the total budget, while campaign decisions still need ROAS.
A simple operating rhythm
- Monthly: set total spend from MER. If MER is comfortably above target, there is room to spend more; if it is below break-even, cut or fix before scaling.
- Weekly: move budget between platforms and campaigns on ROAS. Use each platform's ROAS to rank campaigns, then sanity-check winners against Shopify orders with UTM tags.
- Weekly: check true ROAS on the biggest campaigns. A campaign that wins in Ads Manager on cheap COD orders may lose once RTO is counted.
- Always: watch the gap. If the sum of platform-attributed revenue keeps growing while store revenue doesn't, platforms are claiming more of the same sales.
Tera Ads puts this on one screen: Shopify sales, Meta Ads and Google Ads spend, and profit after returns, plus every campaign from both platforms in one table. It is free for one business, and it means MER and campaign ROAS come from the same numbers instead of three tabs and a spreadsheet. If you're still finding the money that ads waste, start with this guide.
Frequently asked questions
Is MER the same as blended ROAS?
Yes, most people use the terms for the same thing: total revenue divided by total ad spend. Some teams define blended ROAS using only attributed revenue, so check which one a report means.
What is a good MER for an ecommerce brand?
Good means above your break-even, which is 1 divided by your contribution margin. A brand with a 50% margin breaks even at 2x MER; one with 33% margin needs 3x.
Should I stop looking at ROAS if I use MER?
No. MER can't tell you which campaign to cut. Use ROAS inside each platform to rank campaigns and creatives, and MER to decide the total budget.
Does MER work for brands that sell on marketplaces too?
Only if you match revenue and spend. If you include Amazon or Flipkart revenue, include marketplace ad spend too, or calculate MER for your own store alone.
How does RTO affect MER?
The same way it affects ROAS: orders that come back were counted as revenue when placed. Calculate MER on delivered revenue, attributed to the month the orders were placed.