True ROAS After RTO and COD: The Number Ads Manager Won't Show You
Platform ROAS counts orders that never get delivered. How to work out true ROAS after RTO, COD failures and returns, with a worked example in rupees.
On this page
True ROAS is the revenue from orders that were actually delivered and kept, divided by what you spent on ads. In India it is often far lower than the ROAS in Ads Manager, because Meta and Google count an order the moment it is placed, while a large share of cash-on-delivery orders come back as RTO. A 3x platform ROAS can be close to break-even once returns are taken out.
Key takeaways
- Ads Manager ROAS counts placed orders; your bank account counts delivered, paid orders. True ROAS uses the second.
- Industry data puts RTO on cash-on-delivery orders at about a quarter of shipments, against under 2% for prepaid.
- Every RTO costs you twice: the sale disappears, and you still pay forward and return freight.
- Measure true ROAS by order cohort and wait for orders to mature (about 30 to 45 days) before judging a month.
- Compare campaigns on true ROAS, not platform ROAS: campaigns that attract COD-heavy, high-RTO buyers look better in Ads Manager than they are.
What platform ROAS actually measures
ROAS, return on ad spend, is revenue divided by ad spend. The problem is which revenue. When Meta Ads or Google Ads report a purchase, they count the order value at checkout, attributed to an ad click or view inside their attribution window. They do not know, and are not told by default, whether that order was delivered, refused at the door, cancelled before dispatch or returned a week later.
For a brand where almost everything is prepaid, the gap is small. For an Indian D2C brand where half or more of orders are cash on delivery, the gap is the whole story. You can have a campaign that reports 3.2x in Ads Manager and pays for itself only on paper.
There is a second distortion: attribution itself. Meta and Google each claim credit for orders inside their own windows, so the same order can be counted by both. That is a separate problem, covered in why Meta Ads and Shopify never agree. This guide is about the returns problem, which exists even when attribution is perfect.
How big the RTO gap is in India
Return to origin (RTO) is an order that ships but never reaches a paying customer: refused at the door, unreachable, wrong address, or simply not wanted any more. Almost all of it comes from cash on delivery, because a COD buyer has paid nothing and loses nothing by refusing.
Shipway's ShipNotes report, which looked at millions of D2C shipments in FY2025, found that about 26% of non-prepaid (mostly COD) orders came back, against under 2% of prepaid orders. It also found RTO rose with slow delivery: 22% when the first attempt happened within 1 to 2 days, 35% when it took more than 5 days (coverage of the ShipNotes report, July 2025). COD is still a large share of Indian e-commerce orders, often cited at 60 to 65% (Razorpay, citing ET Prime research).
Your own numbers will differ by category, price point, region and courier, which is exactly why you should measure them rather than borrow an average.
| Order type | Share of orders that come back (FY25) | What it means for ROAS |
|---|---|---|
| Prepaid | Under 2% | Platform ROAS is close to the truth |
| Cash on delivery | About 26% | Roughly a quarter of attributed COD revenue never arrives |
| COD, first attempt after 5+ days | About 35% | Slow couriers make the gap worse |
The true ROAS formula
The cleanest definition:
True ROAS = revenue from delivered, non-returned orders ÷ ad spend for the same period
Two details make it honest:
- Use net revenue. Take the order value after discounts, and exclude GST you collect on behalf of the government. If you compare against ad spend, use ad spend including the GST you actually pay on it, or exclude it consistently on both sides.
- Count returns against the month the order was placed, not the month it came back. An order placed on 28 September that returns on 9 October belongs to September's ROAS. If you book it in October, September looks great and October looks terrible, and both are wrong.
Many brands go one step further and use a profit measure instead of revenue (profit on ad spend, or POAS), because RTO also costs freight. That is the version to make budget decisions on, and we come to it below.
A worked example in rupees
The numbers here are an illustration, not a customer's data. Take one month of a single Meta campaign:
- Ad spend: ₹1,00,000
- Orders attributed by Meta: 400, average order value ₹800, so ₹3,20,000 attributed revenue
- Platform ROAS: 3.2x
- 60% of orders are COD, 40% prepaid
- RTO: 25% of COD orders, 2% of prepaid orders
- Cancelled before dispatch: 5% of all orders
- Customer returns after delivery: 3% of delivered orders
Work it through:
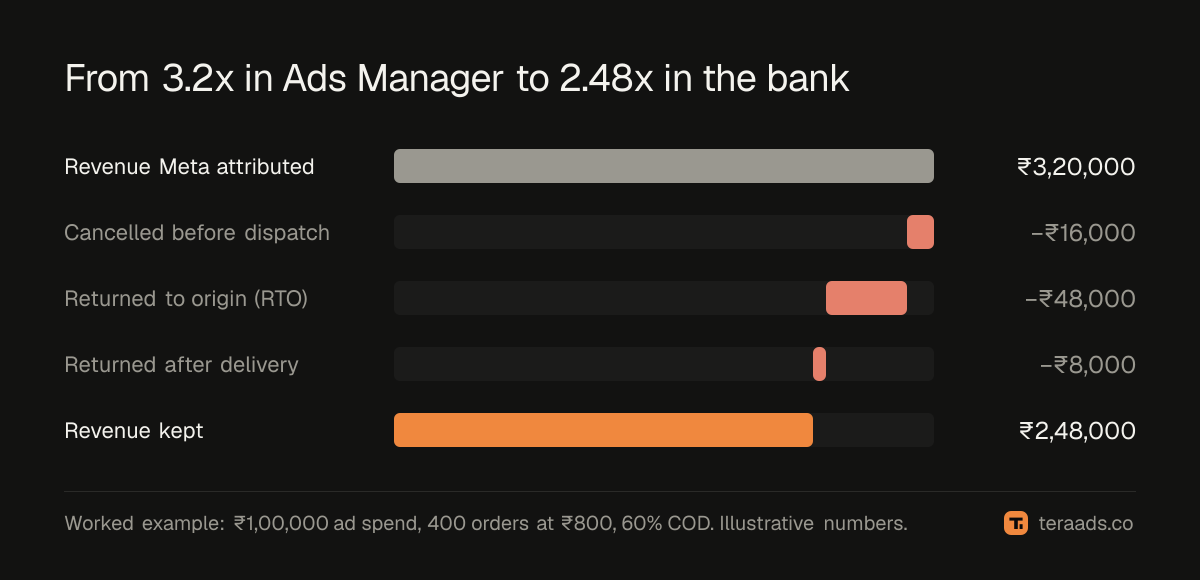
- Cancelled before dispatch: 20 orders, so 380 ship.
- COD shipped: 228, of which 57 come back (25%). Prepaid shipped: 152, of which 3 come back (2%). 60 RTOs in total, so 320 delivered.
- Returned after delivery: about 10 orders (3% of 320). 310 orders are kept and paid for.
- Revenue kept: 310 × ₹800 = ₹2,48,000.
True ROAS = ₹2,48,000 ÷ ₹1,00,000 = 2.48x, against 3.2x in Ads Manager. Nearly a quarter of the reported revenue never arrived.
Now add the freight on those 60 RTOs. Assume ₹70 forward shipping and ₹70 return shipping per parcel: ₹8,400 spent moving parcels that earned nothing. If your contribution margin before ads is 55% of order value, the campaign earns ₹2,48,000 × 55% = ₹1,36,400 of margin, minus ₹8,400 RTO freight, minus ₹1,00,000 ad spend: ₹28,000 profit. Positive, but a long way from what 3.2x suggests, and a 35% RTO month would wipe most of it out.
Why COD-heavy campaigns look better than they are
The algorithms behind Meta and Google optimise for the conversion event you send them, usually Purchase at checkout. If COD buyers convert more easily (they do: no payment step, no risk), the algorithm will happily find more of them. Some of those buyers are exactly the people most likely to refuse delivery.
The result is a quiet bias. Two campaigns with the same platform ROAS can have very different true ROAS:
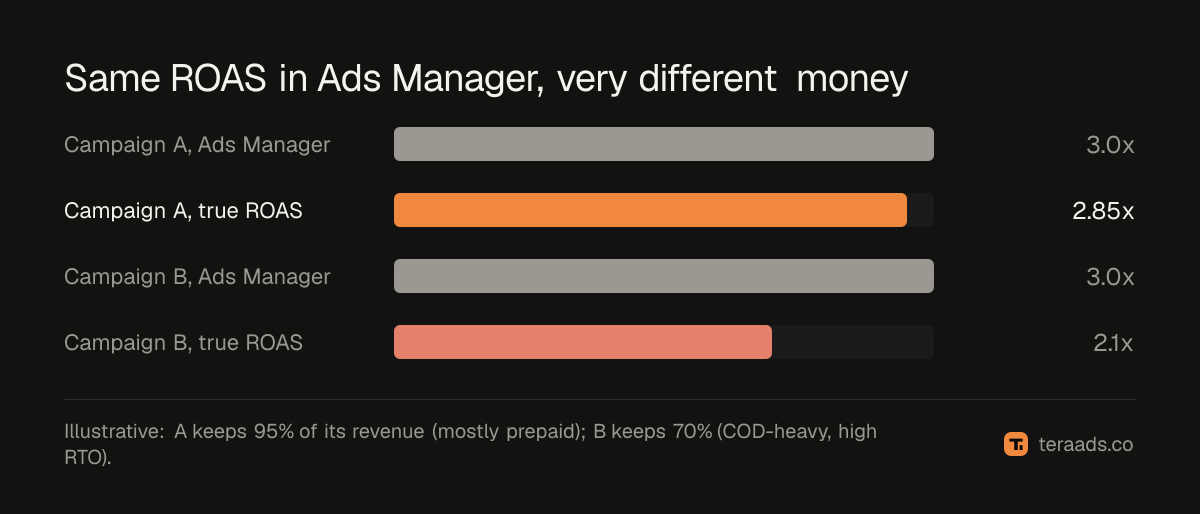
Campaign A sells mostly prepaid to repeat-intent buyers and keeps 95% of its revenue. Campaign B wins cheap COD orders from cold audiences and keeps 70%. In Ads Manager they look identical. In your bank account, A is far better, and if you scale B because it is cheaper per order, you scale your RTO.
This is also why it pays to find wasted ad spend at the campaign level rather than the account level: the account average hides which campaigns bring in the parcels that come back.
How to measure true ROAS every week
You need three data sets joined on the order:
- Orders from Shopify: order ID, date, value, discounts, payment method (COD or prepaid), cancellations and refunds.
- Shipment outcomes from your shipping partner (for example Shiprocket): delivered, RTO, in transit, with dates.
- Ad spend from Meta Ads and Google Ads, by day and by campaign.
Then, for each order-placed week or month:
- Count orders delivered and kept, and their net revenue.
- Leave orders still in transit as pending, not as delivered. Treat a cohort as final only after it matures: most RTOs resolve within 30 to 45 days.
- Divide kept revenue by ad spend for the same dates.
For campaign-level true ROAS you also need attribution: which campaign drove which order. UTM parameters on every ad link let you join Shopify orders to campaigns, imperfectly but far better than nothing.
Doing this in a spreadsheet works for a month. Doing it every week, by campaign, as shipments update, is where most teams give up. Tera Ads does the joining for you: it reads your Shopify orders and Shiprocket shipment outcomes, takes off ad spend from Meta Ads and Google Ads, and shows profit after returns on one screen, free for one business. If you want to start with the rupee cost of your returns first, the RTO cost calculator walks through it line by line.
What to do once you know your true ROAS
Set targets on true ROAS. Your break-even point is set by margin and real delivery rates, not by the number Meta reports. The break-even ROAS guide shows the formula; plug in true ROAS, not platform ROAS.
Translate it back into a platform target. Your team still works in Ads Manager. If your true-to-platform ratio is 0.78 (2.48 ÷ 3.2 in the example), and you need a true ROAS of 2.2x to break even, your platform ROAS floor is 2.2 ÷ 0.78 ≈ 2.8x. Recalculate the ratio monthly: it moves with your COD share and courier performance.
Reduce RTO where it is cheapest. Faster first delivery attempts, address checks at checkout, confirming COD orders before dispatch, and nudging buyers to prepaid all raise true ROAS without touching the ads.
Watch the account-level number too. For overall budget decisions, many brands track MER (marketing efficiency ratio) instead of ROAS: total kept revenue divided by total ad spend, with no attribution argument at all.
Common mistakes
- Judging last week's cohort today. Recent orders look better than they will end up, because their RTOs haven't happened yet. Always mark immature cohorts as provisional.
- Applying a flat RTO percentage. A blanket "minus 15%" hides the campaigns that cause most of your RTO. Use real outcomes per order.
- Booking RTO in the month it arrives. It makes one month look worse and the previous month look better than reality.
- Forgetting freight. RTO isn't just lost revenue: you paid to ship the parcel both ways.
- Comparing true ROAS for one channel with platform ROAS for another. Use the same definition everywhere.
Frequently asked questions
What is a good true ROAS for an Indian D2C brand?
There is no universal number. A good true ROAS is one above your break-even, which depends on your gross margin, shipping and payment costs. A brand with 70% gross margin can be profitable at a true ROAS around 2x; a brand with 40% margin may need 3.5x or more.
Why doesn't Meta subtract RTO from ROAS?
Meta only sees what your site sends it, usually a purchase event at checkout. Delivery happens days later in your courier's system. Unless you send updates back, Meta has no way to know an order was refused.
How long should I wait before calculating true ROAS for a month?
Wait until most orders from that month have a final shipment status. For most Indian brands that is 30 to 45 days after the month ends. Before that, show the number as provisional.
Is true ROAS the same as POAS?
No. True ROAS still uses revenue. POAS, profit on ad spend, uses profit after product cost, shipping (including RTO freight) and fees, which makes it the better number for budget decisions.
Can I just use Shopify's sales report instead of Ads Manager?
Shopify's sales include cancellations and refunds, but not RTOs that your shipping partner hasn't marked as returned in Shopify. You still need shipment outcomes to get the full picture.
Does true ROAS matter if most of my orders are prepaid?
Less, but it still matters. Customer returns, cancellations and discounts still separate reported from kept revenue. The gap is simply smaller.