Choosing Couriers to Cut RTO: Compare on Delivery, Not Just Price
The cheapest courier can cost you more if it delivers fewer parcels. How to compare couriers on delivery rate, speed and NDR, and route orders by region.
On this page
The right courier for a D2C brand is the one that delivers the most parcels on time in each region, not the one with the lowest rate card. A courier that is ₹5 cheaper per shipment but returns a few more COD parcels to origin costs far more, because each RTO adds a second shipping leg and loses the sale. Compare couriers on delivered share, time to first attempt and NDR rate by region, then route orders to the best one for each area.
Key takeaways
- Judge couriers on cost per delivered order, not cost per shipment.
- Time to first delivery attempt drives RTO: Shipway's FY25 data shows 22% RTO within 2 days against 35% after 5.
- Courier performance varies by region, so the best courier differs by zone and city.
- Use your shipping platform's courier rules to route orders by pin code, payment mode and weight.
- Re-check monthly; courier performance changes with hubs, seasons and volume.
Why the cheapest courier often isn't
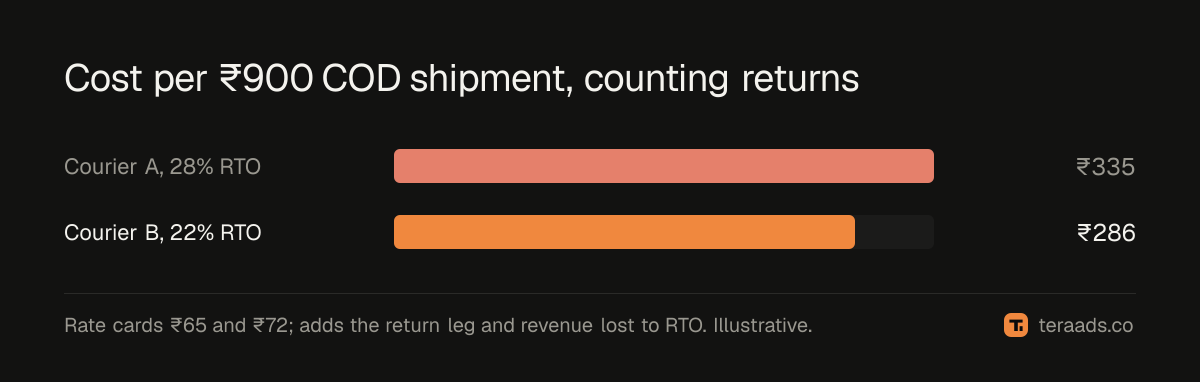
Rate cards compare the price of sending a parcel. What you actually buy is a delivered order. Take an illustrative ₹900 COD order:
| Courier A | Courier B | |
|---|---|---|
| Forward shipping | ₹65 | ₹72 |
| COD RTO rate on your orders | 28% | 22% |
| Expected return-leg cost (₹65 or ₹72 × RTO) | ₹18 | ₹16 |
| Expected lost revenue per shipment | ₹252 | ₹198 |
| Cost per shipment including RTO effect | ₹335 | ₹286 |
Courier A is ₹7 cheaper per shipment but loses about ₹49 more per shipment once returns are counted. Across 1,000 COD orders a month, that's close to ₹49,000. Lost revenue isn't all profit, of course, but even counting only margin and shipping, the better-delivering courier usually wins.
What to compare
Pull the last 60–90 days of settled shipments from your shipping platform and compare couriers on:
- Delivered share: delivered ÷ (delivered + RTO), separately for COD and prepaid.
- Time to first attempt: days from pickup to first delivery attempt. Shipway's FY25 analysis found RTO rising from about 22% when the first attempt came within 1–2 days to about 35% beyond 5 days (Shipway's FY25 RTO findings).
- NDR rate: share of shipments with at least one failed attempt, and how many of those were saved.
- Disputed attempts: how often buyers say nobody came when the courier recorded "customer not available".
- Pickup reliability: missed pickups delay every order.
- Cost per delivered order: total shipping cost, including return legs, divided by delivered orders.
Compare by region, not overall
A courier that's excellent in metros can be weak in smaller towns, and the reverse. Split the comparison by zone, state or city. Shipway's data shows RTO rising from about 20% in zone 1 to 28% in zone 5, and from about 18% in Vadodara to 35% in Patna, so regional differences are large. The best setup often uses different couriers for different regions. Pin code RTO analysis explains how to group areas with enough orders to compare fairly.
Routing orders to the right courier
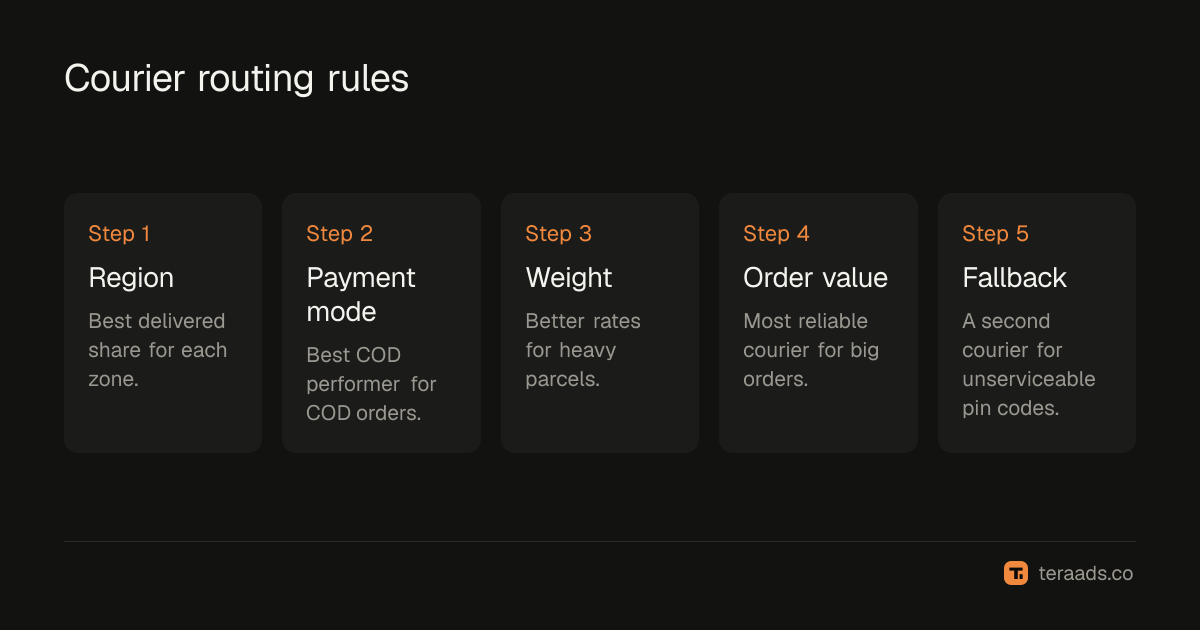
Shipping platforms such as Shiprocket let you set courier priority rules. Typical rules:
- By region: courier X for zones 1–2, courier Y for zones 4–5, based on your delivered share.
- By payment mode: the best COD performer for COD orders; the cheapest reliable courier for prepaid, where RTO is low anyway.
- By weight: some couriers price heavy parcels better.
- By order value: your most reliable courier for high-value orders.
- A fallback: a second courier when the first can't service a pin code.
Working with couriers
Use the data in conversations with couriers and your shipping platform. Share pin codes with high NDR or disputed attempts and ask for action. Keep a log of disputed attempts with order numbers and dates; it makes escalations faster and gives you evidence when negotiating rates. Act fast on failed attempts on your side too; NDR management covers the daily routine.
Reading courier data carefully
Courier comparisons go wrong when the samples differ. If one courier gets mostly prepaid metro orders and another gets COD orders to smaller towns, the second will look worse even if it's the better courier. Compare like with like: the same payment mode, the same zones and, ideally, the same weeks. A courier needs a few hundred settled shipments in a segment before its delivery rate there means much; with fewer, one bad week can swing the result.
Look beyond the final delivered share, too. Days to the first delivery attempt matter, because a COD buyer who waits a week is more likely to refuse. The number of attempts before RTO matters, because some couriers give up after a single try. And the response to non-delivery reports matters: how quickly the courier acts when you ask for a reattempt. NDR management covers that side. Review all of this monthly, since courier performance shifts with seasons, sale periods and changes in their own networks.
Common mistakes
Choosing on rate card alone. The cheapest shipment can be the most expensive delivered order.
One courier for everything. It's simple but leaves money on the table in regions where another courier delivers better.
Comparing on too few orders. Small samples by region mislead; roll up areas until each has enough settled shipments.
Never re-checking. Hubs change, staffing changes and peak seasons strain some couriers more than others. Review monthly.
Ignoring speed. Delivered share at the end hides how long it took. Slow first attempts raise RTO even when the courier eventually tries.
How this fits with your other RTO fixes
Courier choice works alongside order confirmation, prepaid nudges and fast dispatch. Together they attack RTO from both ends: fewer risky orders shipped, and more of the shipped ones delivered. Compare your results with the RTO benchmarks for your payment mix and zones to see where you stand.
Tera Ads shows profit after returns from your Shopify orders, RTO from Shiprocket and ad spend from Meta Ads and Google Ads, with each RTO counted in the month the order was placed. It is free for one business.
Frequently asked questions
Which courier has the lowest RTO in India?
It depends on region, category and your own buyers. Compare couriers on your own settled shipments by zone and city rather than relying on general rankings.
How do I compare couriers fairly?
Use 60–90 days of settled shipments, split by payment mode and region, and compare delivered share, time to first attempt, NDR rate and cost per delivered order.
Should I use several couriers?
Usually yes. Routing each region to the courier that delivers best there typically beats a single courier for everything.
Does a faster courier reduce RTO?
Generally. Shipway's FY25 data shows RTO rising sharply as time to first delivery attempt grows, so faster first attempts help.
How often should I review courier rules?
Monthly, and after any big change such as a new warehouse, peak season or a courier's service changes.