RTO Rate Benchmarks for India: COD, Zones, Order Value and Speed
What RTO rate is normal for an Indian D2C brand? Benchmarks by payment mode, zone, order value and delivery speed from Shipway's FY25 data.
On this page
There is no single "normal" RTO rate in India; it depends mostly on how much of your volume is cash on delivery, where you ship and how fast parcels arrive. Shipway's FY25 data puts COD orders at about 26% RTO against under 2% for prepaid, with rates rising from about 20% in the nearest zone to 28% in the farthest, and from 22% to 35% as the first delivery attempt slips past five days.
Key takeaways
- Payment mode is the biggest driver: COD returns to origin at roughly 26%, prepaid at under 2% (Shipway FY25).
- Distance matters: RTO rises from about 20% in zone 1 to about 28% in zone 5.
- Speed matters more: 22% when the first attempt is within 2 days, 35% after 5 days.
- Order value has a weaker, uneven effect: about 25%, 28% and 24% across the three bands.
- Compare your rate with a benchmark built from your own mix, not with one headline number.
Where these numbers come from
The benchmarks below come from Shipway's ShipNotes FY25 analysis of shipments by Indian online sellers, as reported by Media Infoline (Shipway's FY25 RTO findings). They describe shipments across many sellers, so your category, region and customers will shift your own numbers. Use them to see which way each factor pushes, and to sanity-check your rate.
RTO by payment mode
| Payment mode | RTO rate (Shipway FY25) |
|---|---|
| Cash on delivery | About 26% |
| Prepaid | Under 2% |
This is the gap that dominates everything else. With COD still about 60–65% of Indian e-commerce orders (Razorpay on cash on delivery), your overall RTO rate is mostly your COD share multiplied by your COD RTO rate. The COD vs prepaid guide works through what that costs per order.
RTO by delivery zone
Couriers group destinations into zones by distance from the pickup point, from local (zone 1) to the farthest and hardest to reach (zone 5).
| Zone | RTO rate (Shipway FY25) |
|---|---|
| Zone 1 | About 20% |
| Zone 2 | About 23% |
| Zone 3 | About 22% |
| Zone 4 | About 27% |
| Zone 5 | About 28% |
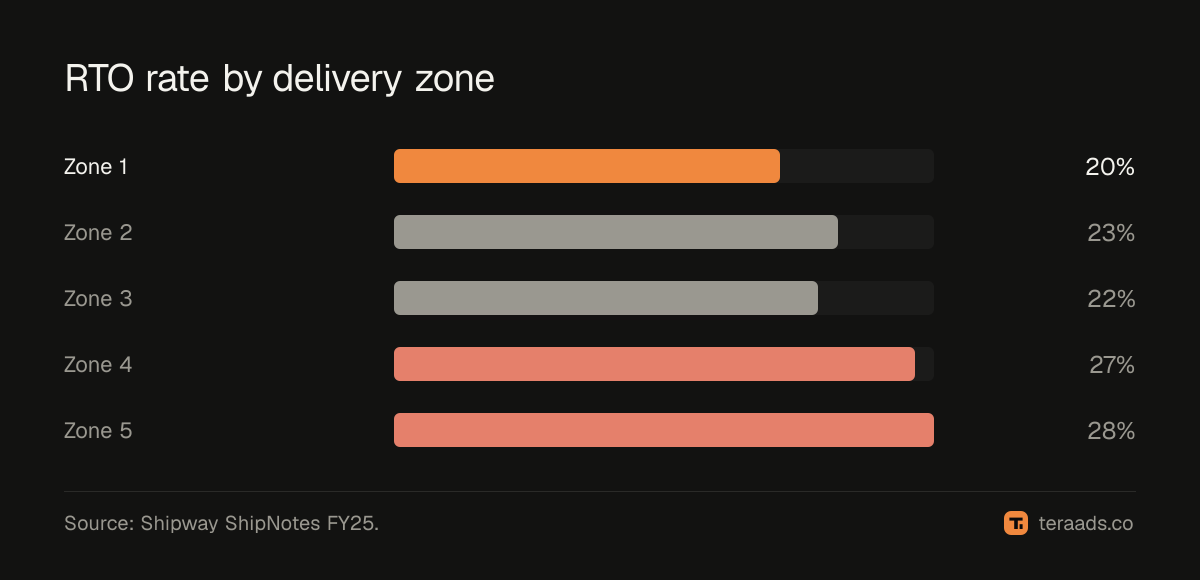
Farther zones mean longer transit, more handovers between hubs and less familiarity with the buyer's area, all of which add failed attempts. City matters too: the same analysis reported rates as low as 18% in Vadodara and as high as 35% in Patna.
RTO by delivery speed
The clearest pattern in the data is time. The longer it takes for the first delivery attempt, the more parcels come back:
- First attempt in 1–2 days: about 22% RTO
- First attempt in 3–5 days: about 27% RTO
- First attempt after 5 days: about 35% RTO
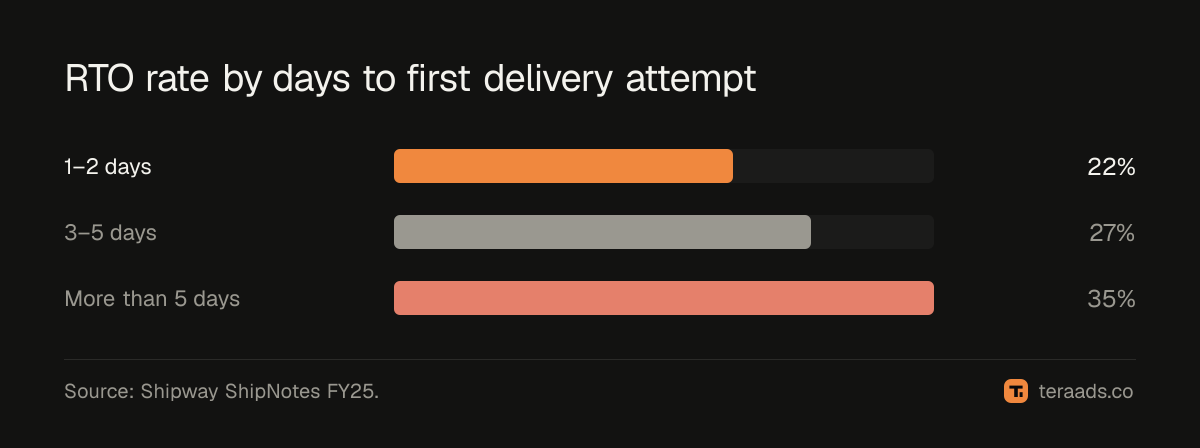
Every day of delay gives the buyer time to change their mind, buy elsewhere or simply forget. Faster dispatch from your warehouse and quick action on failed attempts, covered in the NDR guide, are the levers you control.
RTO by order value
| Order value | RTO rate (Shipway FY25) |
|---|---|
| Under ₹500 | About 25% |
| ₹500 to ₹1,000 | About 28% |
| Over ₹1,000 | About 24% |
Order value matters less than payment mode or speed, and not in a straight line. The middle band returned most often in this data, perhaps because it attracts impulse buyers who still think hard enough to refuse at the door. Check your own bands rather than assuming expensive orders are safer.
Building a benchmark for your own brand
A brand with 80% COD shipping mostly to zones 4 and 5 should expect a much higher RTO rate than one with 40% COD shipping locally. To compare fairly:
- Split your orders by payment mode, zone and days to first attempt.
- Calculate RTO for each group over orders old enough to have settled, usually at least three weeks.
- Compare each group with the matching benchmark above, not your total with a total.
- Find the outliers. A COD rate well above about 26%, or a zone far above its band, is where to dig.
What a high RTO rate is costing you
Each RTO costs shipping both ways, packaging and sometimes damaged stock, and it removes a sale you had counted. It also flatters ad platforms, which count the purchase before it comes back. The RTO cost calculator turns your rate into rupees, and the RTO reduction guide lists the fixes, from order confirmation to prepaid nudges.
How to use these benchmarks
Benchmarks are most useful as a check, not a target. A few ways to use them:
- Spot the outlier factor. If your COD rate is close to the benchmark but your far zones are much worse, the problem is logistics in those regions, not your buyers in general.
- Estimate the effect of a change. If you can bring average time to first attempt down from five days to two, the speed figures suggest RTO could fall meaningfully. Faster dispatch is often the cheapest fix available.
- Explain numbers to your team. A 24% overall RTO with 70% COD isn't a disaster; it's roughly what the payment mix predicts. A 24% rate with 30% COD is a red flag.
- Set realistic goals. Aim to beat the benchmark for your own mix, and track progress monthly.
Remember that benchmarks shift with categories, seasons and couriers. Re-check your own numbers each month rather than relying on a single year's figures.
Tera Ads shows profit after returns from your Shopify orders, RTO from Shiprocket and ad spend from Meta Ads and Google Ads, with each RTO counted in the month the order was placed. It is free for one business.
Frequently asked questions
What is the average RTO rate in India?
It depends heavily on the mix of COD and prepaid orders. Shipway's FY25 data shows about 26% for COD and under 2% for prepaid, so a brand's overall rate mostly reflects its COD share.
What is a good RTO rate for a D2C brand?
One that is at or below the benchmark for your own mix of payment modes, zones and delivery speeds. Compare COD with COD and zone with zone rather than chasing a single number.
Which states or cities have the highest RTO?
It varies by year and courier. Shipway's FY25 data reported rates from about 18% in Vadodara to about 35% in Patna. Check your own RTO by pin code to find your weakest areas.
Do expensive orders have lower RTO?
Not reliably. In Shipway's FY25 data, orders over ₹1,000 returned slightly less often than mid-value orders, but the difference was small compared with payment mode and delivery speed.
How long should I wait before calculating RTO for a month?
At least three weeks after the last order of the month, so most shipments have either been delivered or returned. Earlier numbers understate RTO.