Incrementality Testing for D2C Ads: Did the Ads Cause the Sales?
Incrementality testing measures sales your ads actually caused, not just sales they were credited with. Holdouts, geo tests and budget tests a small brand can run.
On this page
Incrementality is the share of sales your ads actually caused, beyond what would have happened without them. Platform ROAS credits ads with every attributed sale, including buyers who would have bought anyway. An incrementality test compares a group that saw ads with a similar group that didn't. Small brands can run simple versions: holdout audiences, region tests and planned budget changes, judged on total Shopify sales.
Key takeaways
- Attribution answers "which ad was involved?"; incrementality answers "would the sale have happened anyway?"
- Retargeting and brand search are often the least incremental, because they reach people already buying.
- Holdout tests, region tests and budget tests are practical for small brands.
- Judge tests on total Shopify sales or kept orders, never on the platform's own numbers.
- Use results to set budgets: put money where it adds sales, not where it collects credit.
Attribution vs incrementality
Attribution assigns credit for a sale to ads someone clicked or saw. It can't tell you whether the sale needed the ad. A buyer who searched your brand name, clicked your Google ad and bought would very likely have bought through the organic link too. A cart abandoner who returned through a retargeting ad might have returned anyway.
Incrementality asks the counterfactual question directly, by comparing people or places with and without ads.
| Attribution | Incrementality | |
|---|---|---|
| Question | Which ads touched the sale? | Did the ads cause the sale? |
| Method | Tracking clicks and views | Comparing exposed and unexposed groups |
| Typical result | Credits ads generously | Often lower than attributed results |
| Cost | Free, built into platforms | Needs a test and some patience |
Tests a small brand can run
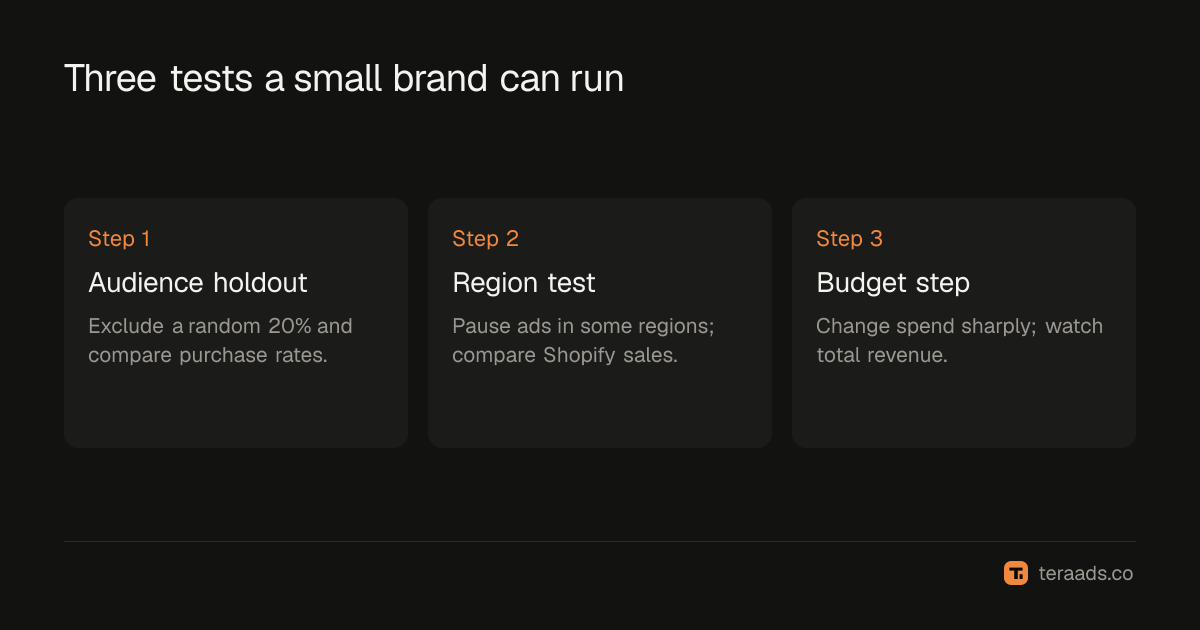
1. Audience holdout
Exclude a random part of an audience from a campaign, such as 20% of site visitors from retargeting, for a few weeks. Compare purchase rates between the held-out group and the rest. The difference is what the campaign adds. Meta and Google also offer lift studies for eligible advertisers, which run this kind of test with their own controls.
2. Region test
Pause or reduce ads in some regions and keep them running in comparable regions. Compare total Shopify sales between the two groups against their normal relationship. This works for any channel, including Google and Meta together, because it uses your own sales data.
3. Budget step test
Change spend on one channel noticeably, such as cutting retargeting by half for two weeks, and watch total Shopify revenue. If revenue barely moves, much of that spend wasn't incremental. Increase spend and watch the same way.
Making tests trustworthy
- One change at a time. Don't launch a sale or new product during a test.
- Long enough. At least two to four weeks, longer for low-volume stores, to smooth out daily noise.
- Comparable groups. Regions with similar past sales patterns; random audience splits.
- Measure what matters. Total orders and revenue from Shopify, ideally kept orders after returns.
- Write down the expectation first, so you judge the result honestly.
What tests usually show
Results vary by brand, but patterns are common:
- Brand search often adds less than its ROAS suggests, especially when no competitor bids on your name; see brand vs non-brand search.
- Retargeting often adds less than its ROAS suggests; see the retargeting guide.
- Prospecting often looks weaker in platform ROAS but adds more new customers and more total sales than its attribution shows.
These patterns are reasons to test, not conclusions to assume.
Living without perfect tests
You won't test everything. Between tests, watch blended numbers: total Shopify revenue against total ad spend (MER), and new customer counts. When spend rises and total revenue doesn't, extra spend isn't incremental. MER vs ROAS explains how to use it.
A worked example
Here's how a simple retargeting holdout might look for a store with steady traffic. The brand excludes a random 20% of its cart abandoners from retargeting for four weeks. During the test, 5,000 people abandon carts: 4,000 can be shown retargeting ads and 1,000 are held out.
Among the 4,000 who could see ads, 480 buy within 14 days, a 12% purchase rate. Among the 1,000 held out, 100 buy anyway, a 10% purchase rate. Retargeting added two percentage points: about 80 extra buyers out of the 4,000, not the 480 a platform might credit.
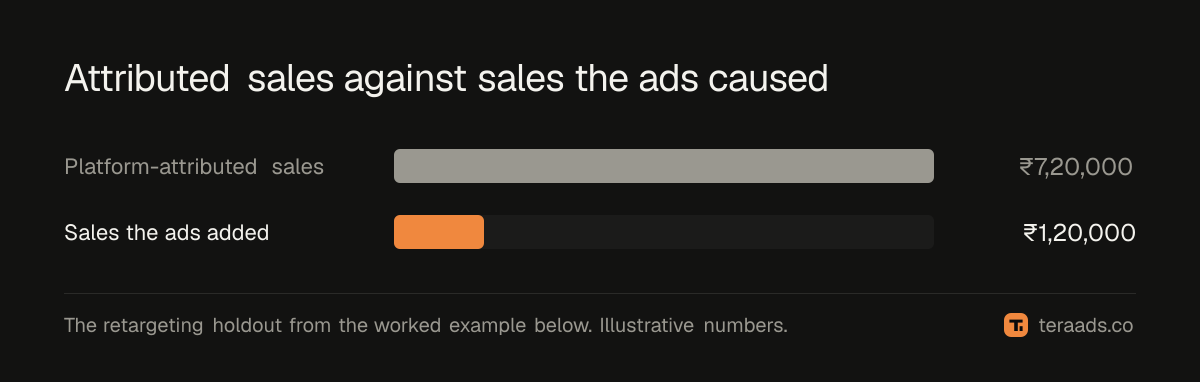
If the campaign spent ₹60,000 and the average order is ₹1,500, the platform might report ₹7,20,000 in attributed sales, a ROAS of 12x. The incremental sales are about 80 orders, or ₹1,20,000, an incremental ROAS of 2x. Whether that's worth it depends on margin. At a 40% contribution margin, ₹1,20,000 of sales brings ₹48,000 of contribution against ₹60,000 of spend, a loss.
The numbers are illustrative, but the pattern is common. The holdout didn't show that retargeting was useless; it measured what retargeting was worth, which is the number budget decisions need.
Expect noise at small scale. With only 100 buyers in the holdout, part of the gap between 10% and 12% could be chance. Running the test longer, or repeating it, makes the result more reliable.
Common mistakes
Judging on platform data. The platform's numbers are what you're trying to check.
Too short. A week of data is mostly noise for small brands.
Changing other things. Launching an offer mid-test spoils the comparison.
Testing tiny changes. A 5% budget change is hard to detect; test meaningful differences.
Never acting on results. A test is only useful if budgets move afterwards.
Tera Ads shows Shopify sales, Meta Ads and Google Ads spend, and profit after returns on one screen, so you can watch total results while a test runs. It is free for one business.
Frequently asked questions
What is incrementality in advertising?
The sales an ad actually caused, compared with what would have happened without it. It's measured by comparing groups that saw ads with similar groups that didn't.
Why is incrementality lower than attributed results?
Attribution credits ads for sales they touched, including sales that would have happened anyway. Incrementality counts only the extra sales.
Can small brands test incrementality?
Yes, with simple tests: audience holdouts, region tests and planned budget changes, judged on total Shopify sales over a few weeks.
Which campaigns are least incremental?
Often brand search and retargeting, because they reach people who already intend to buy. Test your own before cutting anything.
How long should an incrementality test run?
Usually two to four weeks or more, depending on order volume, so normal daily swings don't hide the effect.