LTV to CAC Ratio for D2C Brands: How to Calculate It Honestly
LTV:CAC compares what a customer is worth with what it cost to win them. How to calculate it on contribution margin, over a fixed window, and what's healthy.
On this page
The LTV to CAC ratio compares how much profit a customer brings over a set period with what it cost to acquire them. Calculate LTV on contribution margin, not revenue, over a fixed window such as 12 months, and CAC as blended marketing spend per kept new customer. A ratio of 1 means you only got your money back; above about 3 is often cited as healthy, but payback speed matters as much as the ratio.
Key takeaways
- LTV for this ratio = contribution margin per customer over a fixed window, not lifetime revenue.
- CAC = total marketing spend ÷ new customers who kept their first order.
- Use 6- or 12-month LTV from real cohorts; "lifetime" guesses flatter the ratio.
- A ratio around 3 is a common rule of thumb; the right target depends on cash and risk.
- Pair the ratio with payback time: how many months until a customer covers their CAC.
The formula
LTV:CAC = (contribution margin per customer over the window) ÷ (blended CAC).
LTV here means the contribution margin (CM2: revenue minus product cost, shipping, fees and returns) a customer generates over the window, including their first order. Using revenue instead would make the ratio three or four times too generous for most product brands. Contribution margin explains CM2.
CAC means all marketing spend in a period divided by the new customers acquired in it, after removing first orders that were cancelled or returned to origin. Blended CAC covers this in detail.
A worked example
An illustrative jewellery brand looks at customers acquired in January and follows them for 12 months:
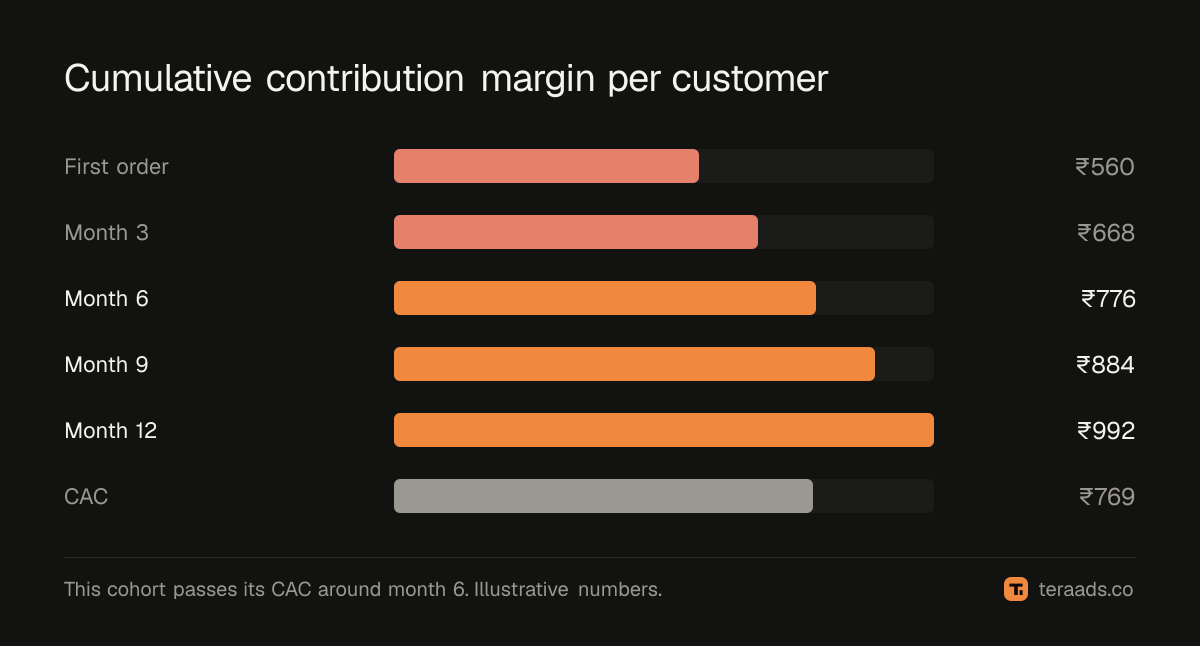
- Average first order: ₹1,400 at 40% CM2 = ₹560
- Repeat orders in 12 months: 0.8 per customer, averaging ₹1,200 at 45% CM2 = ₹432
- 12-month LTV (CM2): ₹560 + ₹432 = ₹992
- Blended CAC: ₹769
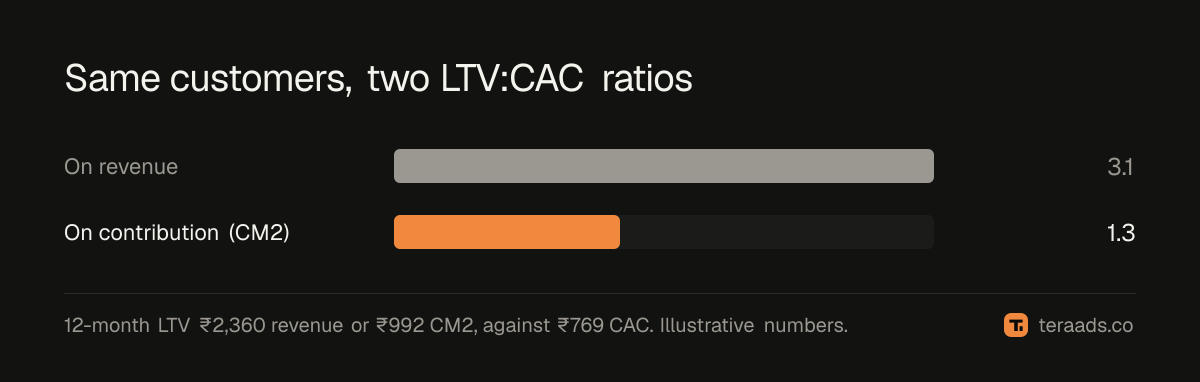
LTV:CAC = ₹992 ÷ ₹769 ≈ 1.3.
On revenue, the same customers look very different: ₹1,400 + (0.8 × ₹1,200) = ₹2,360, a ratio of about 3.1. Same customers, same spend; the revenue version suggests a healthy business, the margin version says customers barely pay back within a year.
| Version | 12-month value | LTV:CAC |
|---|---|---|
| Revenue-based LTV | ₹2,360 | 3.1 |
| Contribution margin (CM2) LTV | ₹992 | 1.3 |
Use cohorts, not averages
The honest way to measure LTV is by cohort: group customers by the month of their first order and track their contribution margin over the following months. Cohorts show:
- how quickly repeat purchases come;
- whether newer cohorts behave better or worse than older ones;
- when a cohort's margin passes its CAC (the payback month).
Averaging all customers mixes old loyal buyers with last month's newcomers and tells you little about the customers you're acquiring now.
What is a good ratio?
A common rule of thumb is that a ratio around 3 means healthy unit economics, but it was popularised for subscription businesses and needs care in D2C:
| 12-month LTV:CAC (on CM2) | What it usually means |
|---|---|
| Below 1.0 | Customers don't pay back within a year; acquisition loses money unless retention is long and proven |
| 1.0 to 2.0 | Paying back; thin room for fixed costs and mistakes |
| 2.0 to 3.0 | Healthy for many D2C brands |
| Above 3.0 | Strong; you may be under-investing in growth |
Payback speed matters as much. A ratio of 3 that takes three years to arrive ties up cash for three years; a ratio of 1.5 reached in two months funds its own growth.
Improving the ratio
- Raise first-order margin: bundles, better pricing, fewer discounts. A first order that covers CAC makes everything else easier.
- Cut RTO on first orders: prepaid nudges and order confirmation mean more acquired customers actually stay acquired.
- Earn repeat purchases: post-purchase emails, replenishment reminders, a reason to come back.
- Cut acquisition waste: campaigns that lose money after returns raise CAC for nothing. POAS helps find them.
LTV:CAC by channel and campaign
The blended ratio tells you whether acquisition works overall. Splitting it shows where. Calculate LTV by acquisition source: customers whose first order came from Meta prospecting, from Google non-brand, from influencers. Some channels bring customers who buy once; others bring customers who return. A channel with a higher CAC can still be the better investment if its customers are worth more over 12 months.
To do this, tag first orders with their source using UTM parameters, follow each group's contribution margin over time, and compare against the spend that acquired them. Small brands may need several months of data before the groups are large enough to trust.
Keep the comparison honest by removing first orders that were cancelled or returned to origin, and by using the same window for every channel. Campaigns that attract impulse cash-on-delivery buyers often look cheap on CAC and poor on LTV.
Common mistakes
Using revenue for LTV. It inflates the ratio several times over for product brands.
Open-ended lifetimes. Assuming customers keep buying for years without data to show it.
Mixing windows. Comparing 12-month LTV with CAC from a different period, or cohorts of different ages.
Counting failed first orders. A customer whose only order was returned to origin wasn't acquired, but still cost money. Include their acquisition cost and exclude them from LTV.
Tera Ads shows Shopify sales, Meta Ads and Google Ads spend, and profit after returns on one screen, with every campaign from both platforms in one table. It is free for one business.
Frequently asked questions
Should LTV use revenue or profit?
Contribution margin. Revenue-based LTV makes the ratio look several times better than it is for most product brands.
What time window should I use for LTV?
A fixed window such as 6 or 12 months, measured from real cohorts. Open-ended "lifetime" estimates rely on guesses about the future.
Is 3:1 a good LTV to CAC ratio for D2C?
It's a common benchmark. For D2C, also check how fast customers pay back; a fast payback at a lower ratio can be healthier than a slow one at 3:1.
How do I calculate LTV in Shopify?
Export orders with customer IDs, group customers by first-order month, and sum each cohort's contribution margin over the following months. Divide by the number of customers in the cohort.
Why is my LTV:CAC below 1?
Either CAC is high, first orders carry thin margins, or customers rarely return. Check which part moved; RTO on first orders is a common hidden cause.