Marketing Mix Modelling for Small Brands: When It Helps and When It Doesn't
Marketing mix modelling estimates what each channel adds from weekly sales and spend, without tracking. What it needs, free tools, and when it suits small brands.
On this page
Marketing mix modelling (MMM) estimates how much each channel contributes to sales by analysing weekly sales against weekly spend, prices, seasons and promotions, without tracking individual users. It's immune to cookie and iOS limits, but it needs two or more years of steady data, real variation in spend and some statistical skill. For most small brands, MER and simple incrementality tests answer the same questions sooner; MMM becomes useful as budgets and channels grow.
Key takeaways
- MMM uses aggregate data, weekly sales and spend by channel, so privacy changes don't affect it.
- It needs a long history, usually two years or more of weekly data, with meaningful changes in spend.
- Free, open-source tools exist: Google's Meridian and Meta's Robyn.
- Results are estimates with uncertainty; they're best confirmed with tests.
- Small brands usually get more from MER, UTMs and holdout tests before they're ready for MMM.
How MMM works
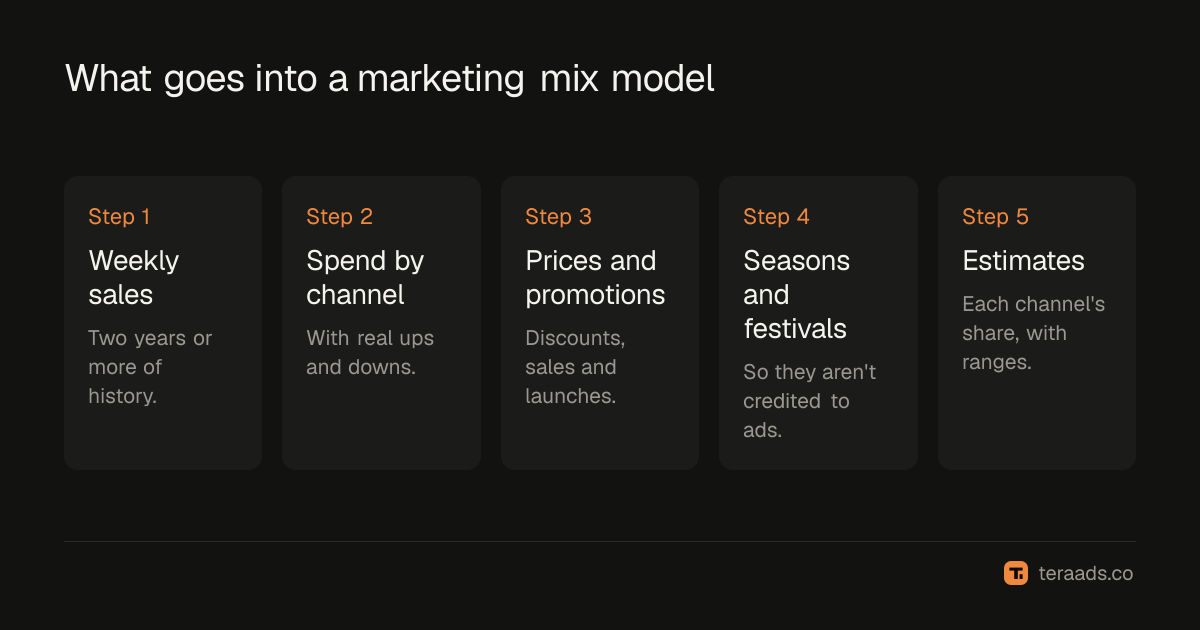
An MMM is a statistical model that explains weekly sales using everything that might drive them: spend on each ad channel, prices and discounts, festivals and seasons, product launches and baseline demand. By seeing how sales moved when spend on a channel rose or fell, it estimates that channel's contribution and how returns diminish as spend grows.
Because it never tracks individuals, MMM isn't affected by ad blockers, iOS privacy features or attribution windows. It can also include channels that tracking can't see, such as TV, outdoor or influencer spend.
What it needs
| Requirement | Why | Typical minimum |
|---|---|---|
| Weekly sales history | The model learns from patterns over time | Two years or more |
| Weekly spend by channel | To relate spend changes to sales changes | Same period |
| Variation in spend | Flat spend gives the model nothing to learn from | Clear ups and downs per channel |
| Other drivers | Prices, promotions, festivals, launches | Recorded weekly |
| Skill and time | Building and checking the model | Someone comfortable with statistics |
The variation point catches many brands out. If Meta spend has been almost the same every week, the model can't tell what Meta adds. Some brands deliberately vary spend for a few months before building a model.
Open-source tools
Meridian is Google's open-source MMM, made generally available in early 2025. It uses Bayesian methods, can include prior knowledge such as test results, and is designed for analysts working in Python.
Robyn is Meta's open-source MMM package, in R, which automates many modelling choices and produces budget allocation suggestions.
Both are free, but neither is a dashboard: you need data preparation, modelling judgement and time to interpret results. Paid MMM services exist for brands that would rather buy the expertise.
When MMM suits a small brand
MMM starts to make sense when:
- You spend across several channels, including some that tracking can't measure well.
- You have two or more years of weekly data with real swings in spend.
- Monthly ad spend is large enough that a better split between channels is worth weeks of analysis.
- Someone on the team, or a partner, can build and question the model.
For a brand spending mainly on Meta and Google, with a year of history, MMM usually produces wide, uncertain estimates.
What to use before MMM
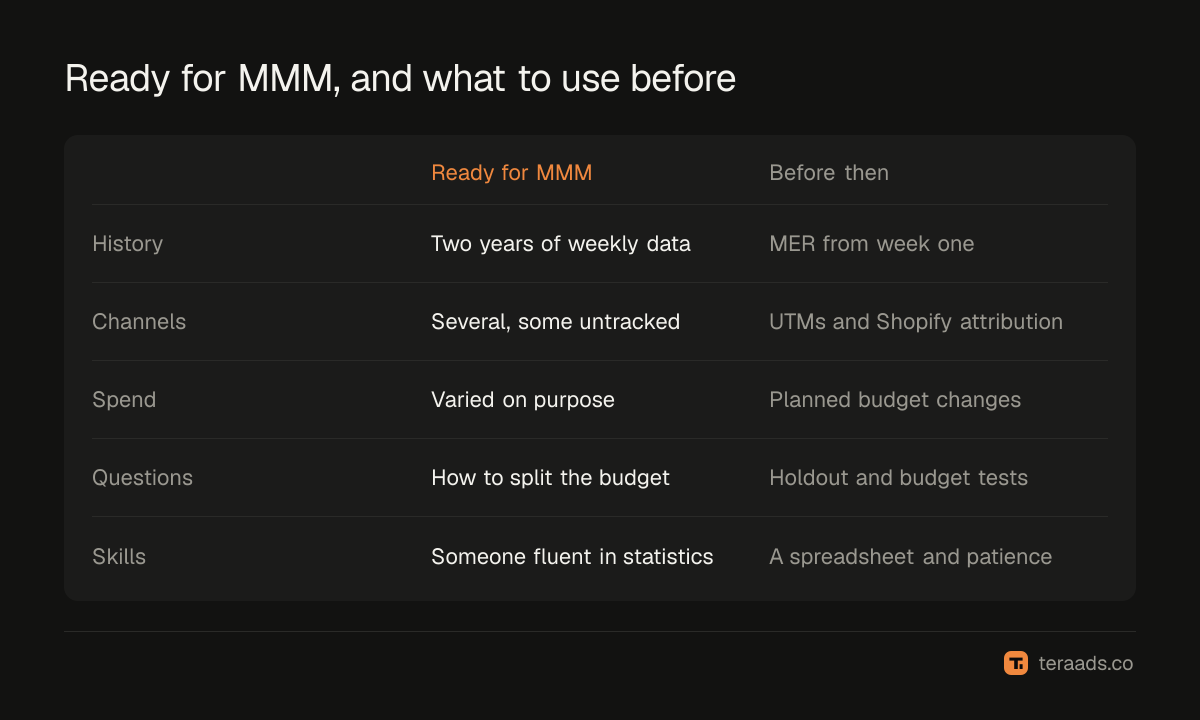
- MER. Total revenue divided by total ad spend, tracked weekly, shows whether the whole system is working; see MER vs ROAS.
- UTMs and Shopify attribution. First and last click views show channel roles; see first-click vs last-click.
- Incrementality tests. Holdouts, region tests and budget steps answer specific questions directly; see incrementality testing.
- Planned spend changes. Varying spend on purpose now gives you better data for a model later.
Reading MMM results carefully
An MMM gives estimates with ranges, not exact answers. If a model says Meta's return is between 1.5x and 3.5x, that range matters as much as the middle. Check results against what you know from tests, and be wary of models that recommend moving most of your budget at once. The best use is directional: which channels look saturated, which have room, and which tests to run next.
A worked example
Imagine an illustrative brand with three years of weekly data across Meta, Google and influencer spend. It varies Meta spend on purpose for three months, raising it 40% for a few weeks and cutting it 30% for a few more, while keeping other channels steady. The model then estimates:
- Meta: about 32% of sales, with returns diminishing above ₹3 lakh a week.
- Google: about 18%, much of it from brand search that would partly happen anyway.
- Influencers: about 9%, with a delay of two to three weeks between spend and sales.
- Baseline: the remaining sales, from repeat customers, organic search and word of mouth.
The useful insight isn't the precise percentages, which come with wide ranges. It's the shape: Meta has room below ₹3 lakh a week and little above it, influencer spend works with a lag, and brand search is less incremental than its ROAS suggests. Each is a hypothesis to test with a holdout or budget change before moving large amounts of money.
Notice the deliberate variation. Without the planned rise and cut in Meta spend, the model would have had little to learn from. A brand that hasn't done this can start now: plan a few months of measured changes in spend per channel and record them. You'll have better data for a model later, and better answers from simple before-and-after comparisons in the meantime.
Common mistakes
Building a model on flat spend. Without variation, results are guesses.
Too little history. A year of data rarely captures seasons and festivals well.
Treating results as precise. Read the ranges, not just the central estimate.
Ignoring returns. For COD brands, model kept revenue, not orders placed.
Skipping validation. Confirm big findings with a test before moving budget.
Tera Ads shows weekly Shopify sales, Meta Ads and Google Ads spend and profit after returns on one screen, which is the core data any model or test starts from. It is free for one business.
Frequently asked questions
What is marketing mix modelling?
A statistical method that estimates each channel's contribution to sales from weekly sales, spend and other drivers, without tracking individual users.
Is MMM worth it for small brands?
Usually not at first. It needs years of data with varied spend. MER, UTMs and incrementality tests answer most questions sooner.
What are Meridian and Robyn?
Free, open-source MMM tools: Meridian from Google, in Python, and Robyn from Meta, in R.
How much data do I need for MMM?
Typically two years or more of weekly sales and spend by channel, with meaningful ups and downs in spend.
Does MMM replace attribution?
No. It answers a different question: how much each channel adds overall. Use it alongside attribution and tests.