Cohort Analysis on Shopify: See Whether New Customers Come Back
Cohort analysis groups customers by first-order month and tracks what they do next. How to read Shopify's cohort report, build your own, and use it to set budgets.
On this page
Cohort analysis groups customers by the month of their first order and follows what each group spends afterwards. Instead of one blended repeat rate, you see whether customers acquired in March come back as often as those from January, and how fast their spending pays back what you paid to acquire them. Shopify has a built-in customer cohort report; read it monthly, compare cohorts from different campaigns or channels, and use the payback curve to decide how much a new customer is worth.
Key takeaways
- A cohort is everyone whose first order fell in the same period; you track their later orders and spend.
- Shopify's Customer cohort analysis report groups customers by first-order date and shows retention, sales or average order value over time.
- Compare cohorts, not totals: a rising repeat rate overall can hide newer cohorts that return less.
- Cumulative revenue per customer by cohort shows how long acquisition takes to pay back.
- For COD brands, count only delivered first orders, or RTO inflates the cohort.
Shopify's cohort report
Shopify's reports include a Customer cohort analysis, under Analytics, then Reports, in the Customers category. According to Shopify's Help Center, checked on 8 October 2026:
- Customers are grouped by the date of their first order, and later columns show the chosen metric over the weeks, months or quarters since.
- You can display customer count, retention rate, gross sales, net sales or average order value.
- The default view is a heatmap, with a retention curve as an alternative.
- Cohorts can be filtered by first-order details such as sales channel, marketing channel and product, and by customer location.
- The current period isn't shown, and a period's data appears 72 hours after it ends.
- Detailed customer reports are available on the Shopify, Advanced Shopify and Shopify Plus plans.
Menus change from time to time, and newer stores may see a Cohorts exploration instead; the data is the same.
Reading a cohort table
Each row is a first-order month. Column 0 is that month; column 1 is the next month, and so on. With retention selected, each cell shows the share of the cohort that ordered again in that month.
| First order | Customers | Month 1 | Month 2 | Month 3 |
|---|---|---|---|---|
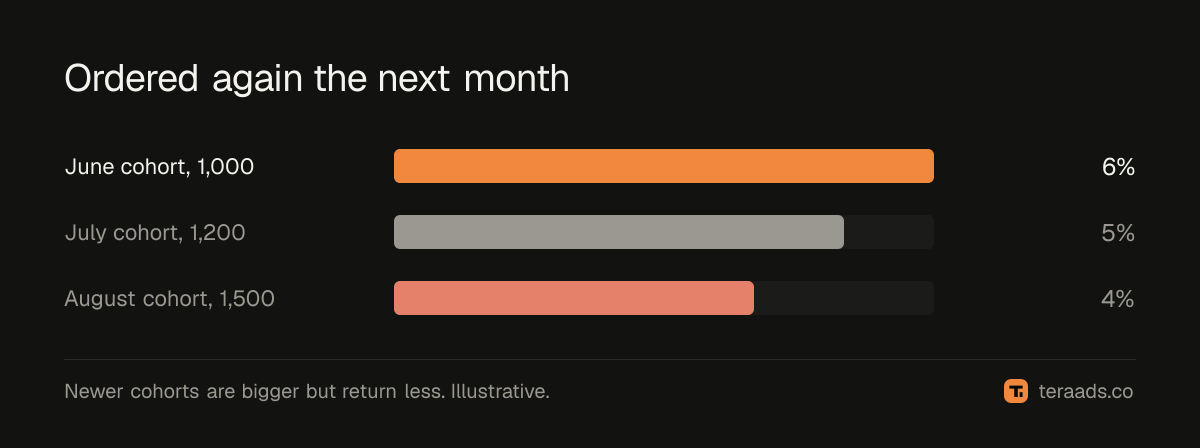
| June | 1,000 | 6% | 4% | 4% |
| July | 1,200 | 5% | 4% | 3% |
| August | 1,500 | 4% | 3% | 3% |
Read down a column to compare cohorts at the same age. Here, each newer cohort returns a little less in month 1, even though more customers were acquired. That pattern often appears when ad spend scales into colder audiences.
Building a payback view, step by step
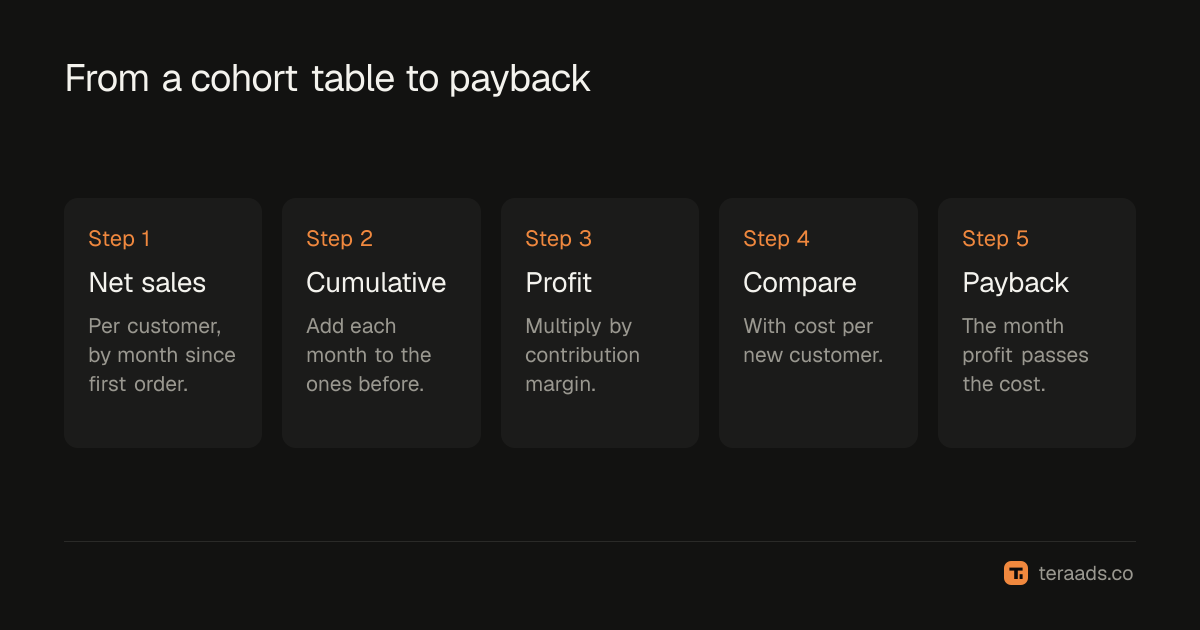
The retention view tells you who returns. The money view tells you whether acquisition pays:
- Choose net sales per customer as the metric, so refunds are excluded.
- Make it cumulative. Add each month's value to the months before, so you see total spend per customer since the first order.
- Subtract costs. Multiply by your contribution margin to turn revenue into profit per customer; contribution margin explains the calculation.
- Compare with acquisition cost. Put your blended cost per new customer for that month beside it.
- Find the crossover. The month where cumulative profit per customer passes acquisition cost is your payback period; CAC payback period shows how to use it.
Comparing cohorts by source
The most useful cut is by how the cohort was acquired. Filter cohorts by marketing channel or first-order product, if your plan's report allows it, or export orders with UTM campaigns and group them yourself.
Typical findings:
- Meta prospecting cohorts often return less than customers from search or referrals, but there are more of them.
- Discount-led cohorts frequently return less than full-price ones, because the offer attracted bargain hunters.
- Hero-product cohorts can return more if the product is consumable or leads naturally to a second purchase.
Each finding changes how much you can pay to acquire a customer through that source. LTV to CAC ratio turns it into a target.
COD and RTO in cohorts
For COD-heavy brands, a refused first order still creates a customer record in Shopify, even though the buyer never received anything. That inflates the cohort size and lowers its apparent repeat rate. Exclude customers whose only order was an RTO, or build cohorts from delivered orders using your shipping data. Otherwise, a campaign with high RTO will look like it brings customers who never come back, when many of them never really became customers.
Doing it in a spreadsheet
If you need cuts your Shopify plan doesn't offer, export orders with customer ID, order date, net amount, UTM campaign and delivery status. In a sheet:
- Find each customer's first delivered order date and assign the cohort month.
- For every order, calculate months since that first order.
- Build a pivot table with cohorts as rows, months since first order as columns, and count of customers or sum of net sales as values.
Exports with customer IDs contain personal data; keep them private and delete copies you no longer need.
What to do with the results
- Set acquisition budgets by payback. If cohorts pay back in three months, you can spend more upfront than if they never repeat.
- Fix retention before scaling. If new cohorts return less, scaling ads will lower lifetime value further.
- Plan repeat marketing. The month where repeat orders peak is when reminders and offers work best.
Common mistakes
Reading totals instead of cohorts. Old loyal customers can mask weaker new ones.
Including the current month. It's incomplete; Shopify leaves it out for that reason.
Counting refused COD orders as customers. They inflate cohorts and depress repeat rates.
Ignoring cohort size. A small cohort's rates swing a lot.
Using revenue instead of profit for payback. Margins and returns decide whether a customer paid back.
Tera Ads shows Shopify sales, Meta Ads and Google Ads spend and profit after RTO from Shiprocket, so you can see what each month's new customers cost beside what your cohorts go on to spend. It is free for one business.
Frequently asked questions
What is cohort analysis in ecommerce?
Grouping customers by when they first ordered and tracking their later orders and spending, so you can compare groups at the same age.
Does Shopify have a cohort report?
Yes. The Customer cohort analysis report groups customers by first-order date and shows retention, sales or average order value over time. Detailed customer reports depend on your plan.
How often should I review cohorts?
Monthly. Compare the newest complete cohort with earlier ones at the same age.
How do cohorts help with ad budgets?
Cumulative profit per customer by cohort shows how quickly acquisition pays back, which tells you how much you can afford to pay for a new customer.
Should I remove RTO orders from cohorts?
Yes, for COD-heavy stores. Customers whose only order was refused never received a product and distort repeat rates.