Contribution Margin by Product: Find Which Products Pay for Their Ads
Store-level margin hides products that lose money once RTO and ad spend are counted. How to calculate contribution margin per product and what to do with it.
On this page
Contribution margin by product is what each product earns per delivered order after its product cost, shipping and fees, its own RTO rate and the ad spend it takes to sell it. Store-level margin averages winners and losers together, so a best seller with high RTO and expensive ads can quietly lose money while another product carries the business. Calculate it per product for a settled month, rank by total contribution, and shift ad budget and attention accordingly.
Key takeaways
- Products differ in margin, shipping weight, RTO rate and ad cost, so their real profit differs far more than their gross margin suggests.
- Contribution per delivered order = price − product cost − shipping and fees − expected RTO cost − ad cost per delivered order.
- Allocate ad spend to products from product-level campaigns where possible, or by each campaign's product mix in Shopify orders.
- Rank by total contribution, not just margin percentage; a lower-margin product that sells in volume can earn more.
- A product that loses money after ads may still be worth keeping if it brings customers who repeat.
Why store-level margin isn't enough
Gross margin per product is easy to see in Shopify once cost per item is entered. It ignores the costs that differ most between products: how often each product is refused on delivery, how heavy it is to ship, and how much ad spend it takes to sell. A product with a 70% gross margin can lose money if its ads are expensive and a third of its COD orders are refused.
A worked example
| Product | Price | Product, shipping, fees | RTO cost (rate) | Ad cost | Contribution | Margin |
|---|---|---|---|---|---|---|
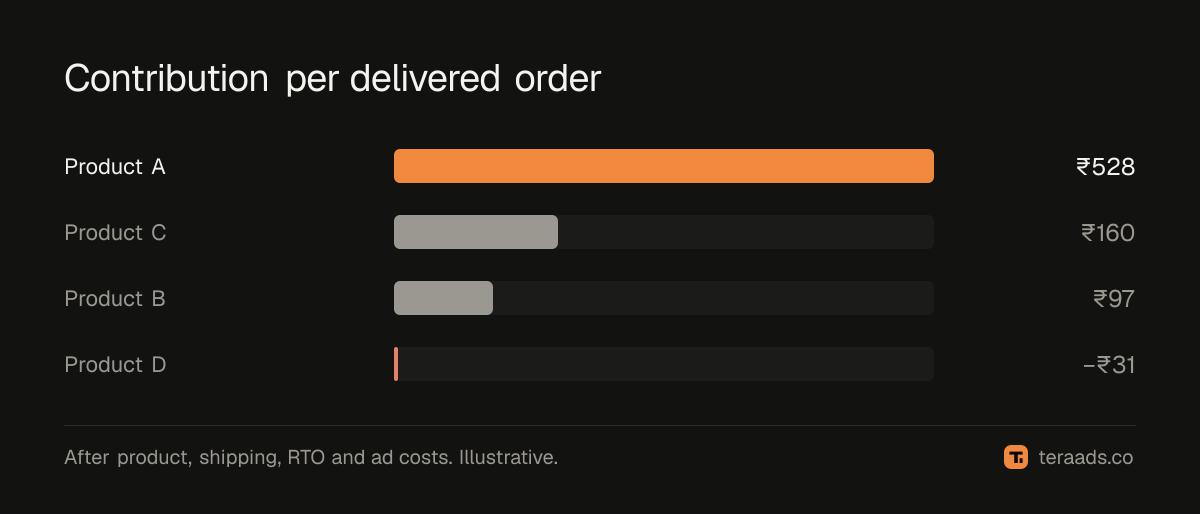
| A | ₹2,000 | ₹840 | ₹32 (15%) | ₹600 | ₹528 | 26% |
| B | ₹800 | ₹350 | ₹53 (25%) | ₹300 | ₹97 | 12% |
| C | ₹1,200 | ₹480 | ₹40 (20%) | ₹520 | ₹160 | 13% |
| D | ₹1,000 | ₹495 | ₹86 (35%) | ₹450 | −₹31 | −3% |
Product D's product cost is only ₹380, a 62% gross margin, yet it loses ₹31 on every delivered order once its high RTO and ad cost are counted.
Calculating it, step by step
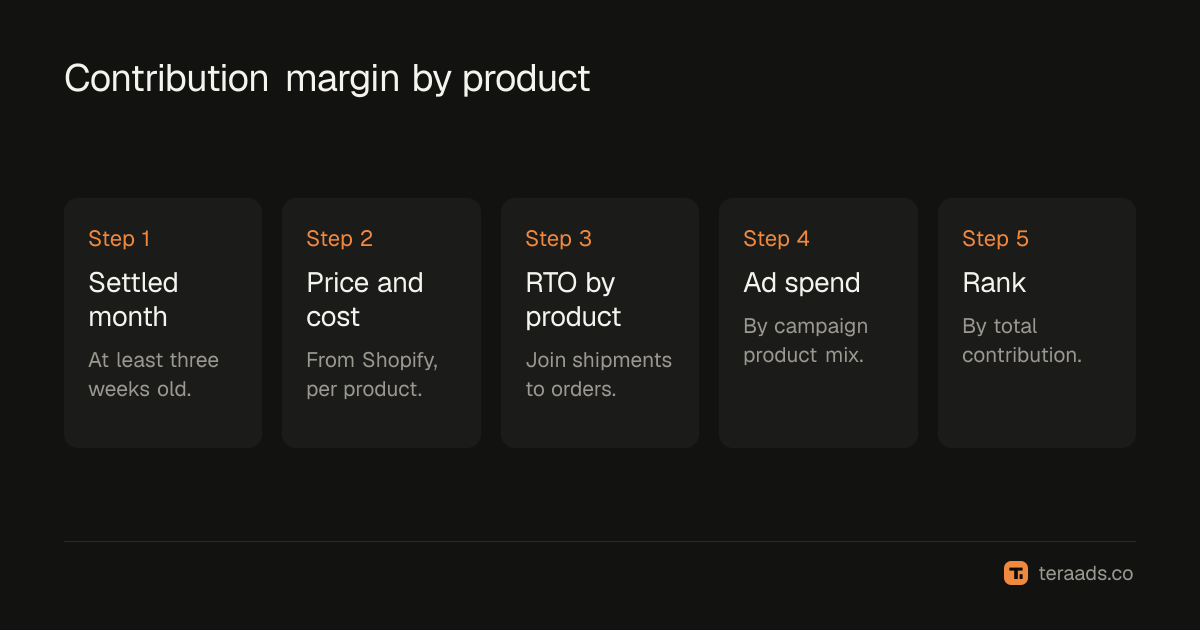
- Pick a settled month, at least three weeks old, so RTO has mostly resolved.
- Get price and cost per product from Shopify: net sales per unit and cost per item.
- Add shipping and fees per order for each product, from courier invoices; heavier or fragile products cost more.
- Calculate RTO by product. Join shipments from your shipping platform to Shopify orders, then divide RTO by delivered plus RTO for each product. For multi-product orders, assign the order to its highest-value item.
- Allocate ad spend to products using the methods below.
- Calculate contribution per delivered order and in total for each product.
Allocating ad spend to products
This is the hardest part, and there are three ways to do it, from best to roughest:
- Product-level campaigns. If a campaign or ad set promotes one product, its spend belongs to that product.
- Campaign product mix. For catalogue, Shopping and Performance Max campaigns, take the orders each campaign brought in Shopify, by UTM, and split its spend by each product's share of those orders' revenue.
- Revenue share. As a fallback, split total ad spend by each product's share of total revenue. It's rough, because it assumes every product is equally expensive to sell.
Google's Shopping reports and Meta's catalogue reports can show spend or results by product for some campaign types; use them where available and check them against Shopify orders. RTO by campaign shows how to join campaigns, orders and shipments.
What to do with the results
Scale the strong products. Products with high contribution and room to grow deserve more ad budget and better placement on your site.
Fix before cutting. A product that loses money because of high RTO may need a better description, size guide or prepaid incentive, not removal. One that loses money because of ad cost may need new creative.
Stop advertising the losers. If a product loses money after ads and doesn't bring customers who repeat, stop paying to sell it and let it sell organically.
Use strong products as the entry point. Lead ads with products that earn well on the first order, and let the rest sell through bundles and repeat purchases; increasing average order value covers bundles.
Watch total contribution, not just margin
A product with a 12% margin selling 1,000 orders a month earns ₹97,000 in the example above, more than a 26% margin product selling 150 orders. Rank products by total contribution first, then look at margin to see where improvement is possible.
When a loss-maker is worth keeping
Some products lose money on the first order but bring customers who repeat on higher-margin products. Check repeat behaviour for customers whose first order was each product, using Shopify's cohort report filtered by first-order product or your own export; cohort analysis on Shopify explains how. If D's buyers come back and buy A, D may be a good acquisition product at the right ad cost.
Presenting it to your team
Keep the product view to one table that anyone can read: product, delivered orders, contribution per order, total contribution and the main reason for any loss, such as RTO, ad cost or margin. Sort by total contribution. Add one line under the table with the decision for each product this month: scale, fix, hold or stop advertising. Next month, check whether each decision moved the number it was meant to.
Common mistakes
Using gross margin only. RTO and ad cost differ most between products.
Splitting ad spend evenly. Some products are much more expensive to sell.
Using an unsettled month. RTO by product needs time to resolve.
Ignoring order mix. Multi-item orders need a consistent rule for which product gets them.
Cutting products without checking repeats. Some loss-makers bring valuable customers.
Tera Ads shows Shopify sales, Meta Ads and Google Ads spend and profit after RTO from Shiprocket for every campaign, which tells you which campaigns, and the products they promote, really make money. It is free for one business.
Frequently asked questions
What is contribution margin by product?
What each product earns per delivered order after product cost, shipping and fees, RTO and ad spend.
How do I allocate ad spend to products?
Use product-level campaigns where possible, split catalogue campaigns by the product mix of their Shopify orders, and fall back to revenue share.
Why does RTO matter at product level?
RTO rates differ between products, and a high rate can turn a good gross margin into a loss.
Should I stop selling a product with negative contribution?
Stop advertising it unless its buyers repeat on profitable products. First try fixing RTO, descriptions or creative.
How often should I review product margins?
Monthly, on the last settled month, and after any price, cost or campaign change.