D2C Unit Economics Template: Profit Per Order and Per Customer
Unit economics show what one order and one customer earn after product, shipping, RTO and ad costs. A simple template for Indian D2C brands, with a worked example.
On this page
Unit economics answer two questions: how much does one order earn after every variable cost, and how much does one customer earn over time compared with what you paid to acquire them? For Indian D2C brands, the per-order view must include RTO, because refused COD orders cost freight both ways and earn nothing. Fill in price, product cost, shipping, fees, RTO rate and ad cost per order, then extend it to repeat orders to see what a customer is worth.
Key takeaways
- Profit per order = order value − product cost − shipping and fees − expected RTO cost − ad cost per order.
- Expected RTO cost is the RTO rate multiplied by the cost of each refusal, spread across all orders shipped.
- The first order often loses money or breaks even; repeat orders, which need little or no ad spend, carry the profit.
- Customer value = first-order profit + expected repeat orders × profit per repeat order.
- Update the template monthly from real data, not targets.
The per-order template
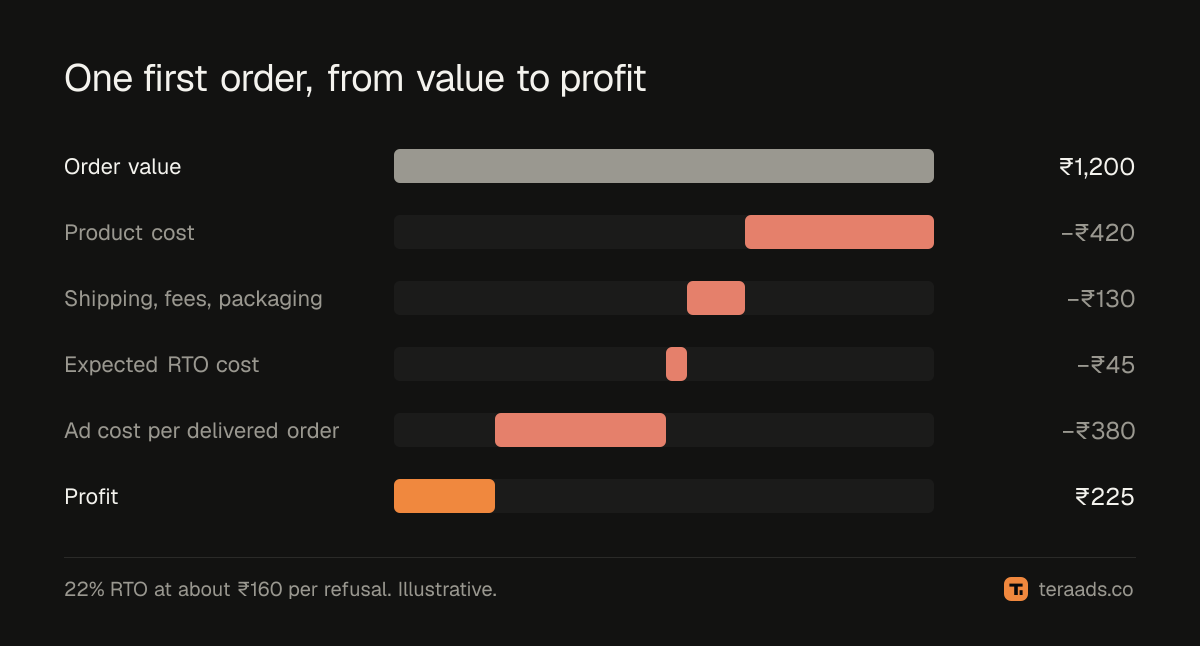
Here is an illustrative first order for a ₹1,200 product, with 60% of orders on COD and an overall RTO rate of 22%:
| Line | How to calculate | Example |
|---|---|---|
| Order value, excluding GST | Average order value | ₹1,200 |
| − Product cost | Cost of goods | ₹420 |
| − Shipping, fees, packaging | Forward freight, payment or COD fee, packaging | ₹130 |
| − Expected RTO cost | Refusals per delivered order × cost of one refusal | ₹45 |
| − Ad cost per delivered order | Ad spend ÷ delivered orders | ₹380 |
| Profit on a first order | ₹225 |
Every line is per delivered order, because only delivered orders produce revenue. With an RTO rate of 22%, each delivered order carries about 0.28 refusals (22 ÷ 78). At about ₹160 per refusal, for freight both ways and handling, that's about ₹45 per delivered order. Use your own numbers; the RTO cost calculator works through each line.
Filling it in, step by step
- Order value. Shopify net sales ÷ delivered orders for a settled month, excluding GST.
- Product cost. Cost per item from Shopify, or purchase records, weighted by what sold.
- Shipping, fees and packaging. From courier and gateway invoices, divided by orders shipped.
- RTO. RTO rate from your shipping platform on settled shipments, multiplied by the cost of one refusal.
- Ad cost per delivered order. Total Meta Ads and Google Ads spend ÷ delivered orders, so refused orders don't flatter the number.
- Profit per order. Subtract everything from order value.
Adding repeat orders
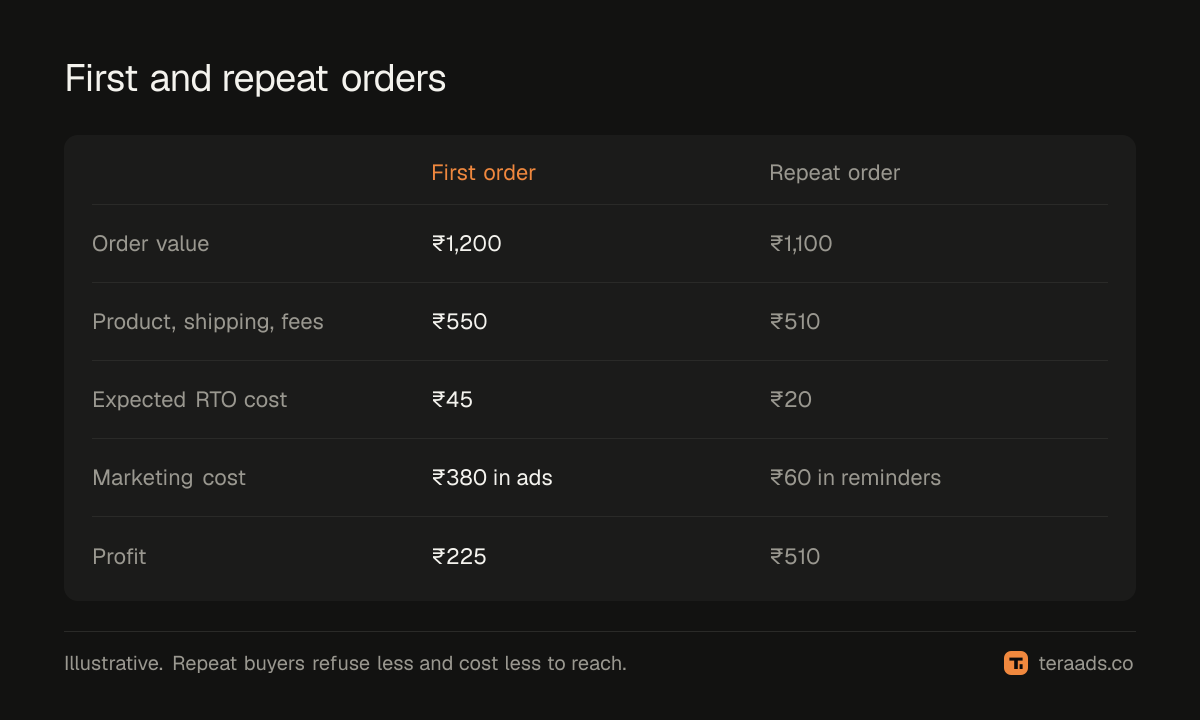
Repeat orders are where most D2C brands make their money, because they need little paid acquisition:
| First order | Repeat order | |
|---|---|---|
| Order value | ₹1,200 | ₹1,100 |
| Product, shipping, fees | ₹550 | ₹510 |
| Expected RTO cost | ₹45 | ₹20 |
| Marketing cost | ₹380 (ads) | ₹60 (email, WhatsApp, offers) |
| Profit | ₹225 | ₹510 |
Repeat buyers refuse less often, since they've received from you before, and cost far less to reach. If an average customer places 0.6 repeat orders in a year, their first-year value is ₹225 + 0.6 × ₹510 ≈ ₹531.
From unit economics to decisions
How much can I pay for a new customer? Add back the ad cost to first-order profit to get profit before ads, ₹605 here, then add expected repeat profit. That's the most you can pay and still break even over the period you choose. LTV to CAC ratio sets a safer target.
Which lever matters most? Change one line at a time. Cutting RTO from 22% to 15%, raising order value by ₹200, or lowering ad cost per order by ₹50 each change profit per order by a different amount. Work on the one with the biggest effect per rupee of effort.
Is a product worth advertising? Run the template per product; contribution margin by product shows how.
Keeping it honest
- Use settled months. RTO and returns need about three weeks to settle.
- Use delivered orders for ad cost per order, not orders placed.
- Use Shopify for revenue, not ad platform reports.
- Update monthly. Costs, RTO and ad prices change; a template filled in once goes stale quickly.
Unit economics and the monthly P&L
The template is the P&L divided by orders. If you multiply profit per order by delivered orders and subtract fixed costs, you should get close to the operating profit in your monthly P&L. If you don't, one of the per-order numbers is wrong, usually ad cost per order or RTO.
Testing a change with the template
Suppose you're deciding between two projects for next month: cutting RTO from 22% to 15% with order confirmation and partial COD, or raising order value by ₹150 with bundles.
- Cutting RTO: refusals per delivered order fall from about 0.28 to about 0.18, saving about ₹17 per delivered order at ₹160 per refusal. Ad cost per delivered order also falls, because the same spend now produces more delivered orders: from ₹380 to about ₹349. Profit per first order rises by roughly ₹48.
- Raising order value by ₹150: at a 35% product cost, product cost rises by about ₹53 and shipping by a little, so profit per order rises by roughly ₹90, if conversion holds.
In this example the bundle wins on paper, but it carries more risk to conversion. The template makes the trade-off concrete, so you can choose deliberately and then check the result against the next month's actual numbers.
Common mistakes
Leaving out RTO. On COD-heavy stores, refusals change profit per order by a lot.
Dividing ad spend by all orders placed. Refused orders make cost per order look lower than it is.
Judging a brand on first orders alone. Repeat orders often carry the profit.
Using target costs. Use what you actually paid last month.
One template for every product. Margins and RTO vary by product.
Tera Ads shows Shopify sales, Meta Ads and Google Ads spend and profit after RTO from Shiprocket for every campaign, which are the inputs for a per-order view. It is free for one business.
Frequently asked questions
What are unit economics in D2C?
The profit from one order and one customer after variable costs, returns and acquisition cost.
How do I calculate profit per order?
Order value minus product cost, shipping and fees, expected RTO cost and ad cost per delivered order.
Why include RTO in unit economics?
Refused COD orders cost freight both ways and earn nothing. Ignoring them overstates profit per order.
Why do repeat orders matter so much?
They need little ad spend and are refused less, so they usually earn far more than first orders.
How often should I update unit economics?
Monthly, using the last settled month's actual costs and rates.