The 5-Minute Daily Numbers Check for Shopify Brands Running Ads
Five numbers to check each morning when you run Meta and Google ads for a Shopify store, what to compare each against, and how to tell a real problem from noise.
On this page
A useful daily check for a Shopify brand running ads takes five numbers from yesterday: sales, ad spend, return on ads across the store, cost per order against break-even, and returns. Compare each with the same weekday last week and your 7-day average, not with the day before. Act only when a number moves outside its normal daily range or stays off for three days; most single-day swings are chance.
Key takeaways
- Check yesterday, a completed day, not today so far.
- Compare with the same weekday last week and the 7-day average.
- Pair sales with ad spend; neither means much alone.
- Learn your store's normal daily swing so you don't react to noise.
- Leave campaign-level changes for the weekly review unless something is broken.
Why a daily check, and why only five numbers
Owners who run ads tend to check too much or too little. Too much means refreshing sales all day and changing budgets on a bad morning. Too little means finding out at the end of the month that a campaign has been losing money for three weeks. A short, fixed routine sits between the two: five minutes, the same numbers, the same comparisons, every morning.
Five is enough because each answers a different question. Did we sell? What did it cost? Did the ads pay overall? Is each order affordable? Is something coming back? Anything more belongs in the weekly KPI review.
The five numbers
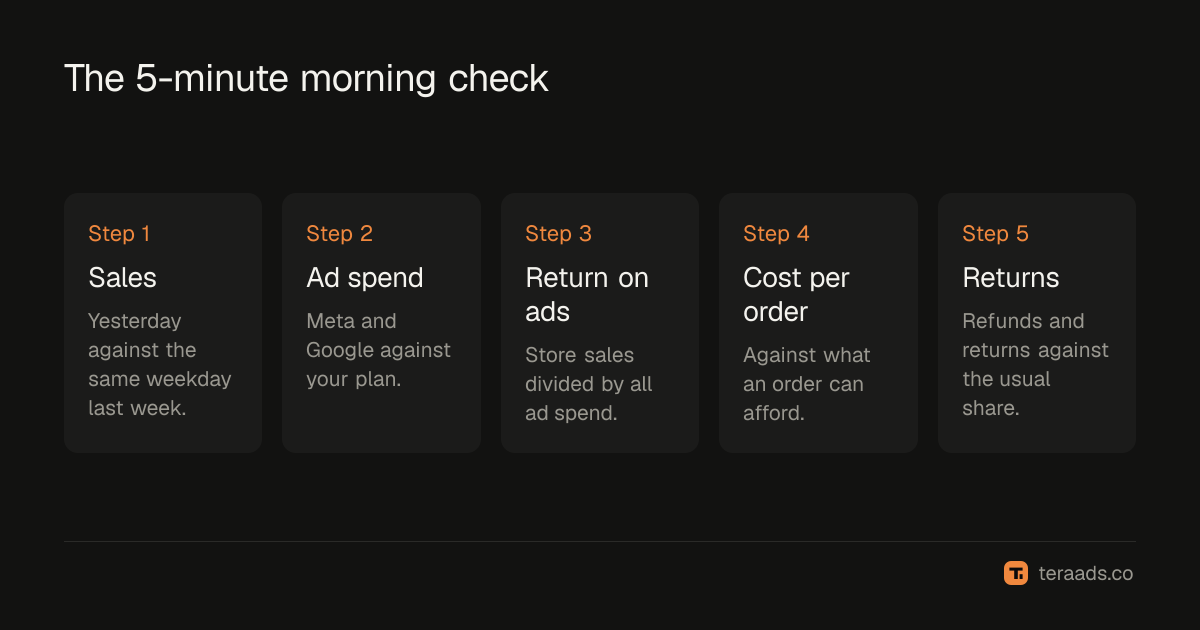
1. Sales. Yesterday's store sales from Shopify, not what Meta or Google report. Compare with the same weekday last week, because weekdays differ and every store has its own weekly pattern.
2. Ad spend. Meta and Google Ads together. Compare with what you planned to spend per day. An unexpected jump usually means a budget was raised, a new campaign started or a rule changed a budget.
3. Return on ads across the store. Store sales divided by total ad spend, sometimes called MER. It can't be inflated by attribution, which makes it the honest daily number. MER vs ROAS explains the difference.
4. Cost per order against break-even. Ad spend divided by orders, against the most an order can afford after product cost, shipping, fees and returns. If you don't know that number, work out your break-even ROAS first.
5. Returns and refunds. Orders refunded or returned yesterday. A sudden rise can point at one product, a delivery problem or a payment issue, and it eats profit the ad numbers never show.
What to compare each number against
| Number | Compare with | Worth a look when |
|---|---|---|
| Sales | Same weekday last week; 7-day average | Outside the normal range two days running |
| Ad spend | Your planned daily spend | More than 20% above plan |
| Return on ads (store-wide) | 7-day average | Below break-even for 3 days |
| Cost per order | Break-even cost per order | Above break-even for 3 days |
| Returns and refunds | 7-day average | Double the usual share |
Noise or a real problem?
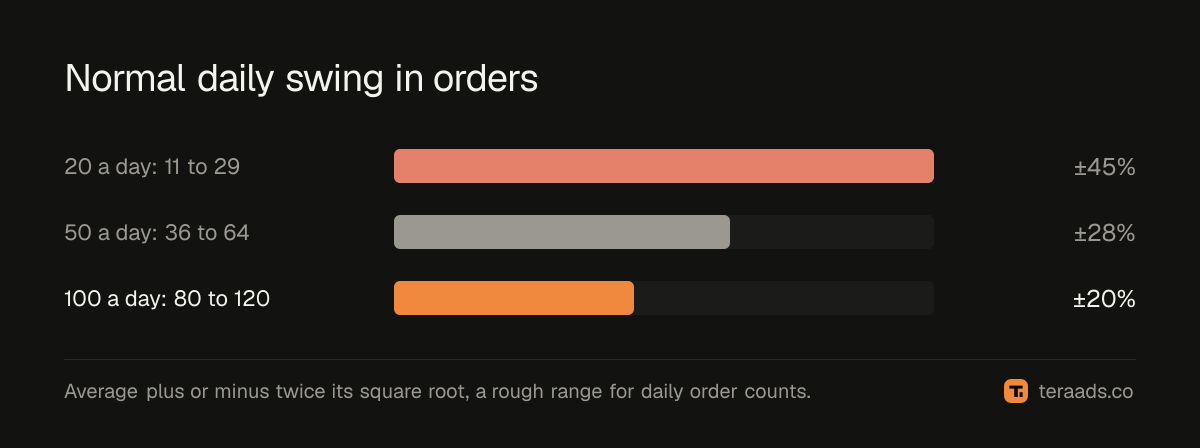
Daily orders swing by chance. A store that averages 20 orders a day will often see 13 one day and 27 the next with nothing wrong at all. For order counts, a rough normal range is the average plus or minus twice its square root: with 20 a day, that's about 11 to 29. With 100 a day it's about 80 to 120, so bigger stores see smaller swings in percentage terms.
That gives a simple rule. A day inside the range is noise; don't change budgets because of it. A day outside the range, or three days in a row on the same side of the average, is worth looking into. The same thinking applies to sales and to return on ads, which inherit the swing in orders.
Worked example: a Monday morning check
An example store averages 20 orders and $1,400 of sales a day, spends about $450 a day on ads and needs a store-wide return on ads of 2.5× to break even.
Sunday's numbers: $1,050 of sales from 15 orders, $470 of ad spend, return on ads of 2.2×, cost per order of $31 against a break-even of $28, and 2 refunds, about the usual.
Fifteen orders is inside the normal range of 11 to 29, so this alone isn't a problem. But the same Sunday last week brought 24 orders, and return on ads has been under 2.5× on two of the last three days. The owner notes it and checks again Tuesday. When Monday also comes in under break-even, it's time for a closer look at the campaigns that spent most, not a panic cut on Sunday's numbers.
These are made-up numbers. The routine is what carries over: compare like with like, know the normal range and wait for a pattern.
Making the check take five minutes
The slow part of a daily check is gathering the numbers. Sales are in Shopify, spend is in two ad accounts, and returns may be in a third place. Three ways to make it quick:
- A spreadsheet you fill each morning. Free and flexible, but it's the gathering itself that takes the time.
- Shopify's own reports. Good for sales and orders; ad spend and margins need adding by hand.
- A profit dashboard. Tools such as Tera Ads put store sales, Meta and Google spend, and estimated profit after returns on one screen. Tera Ads is free for one store; see what it shows.
Whichever you use, the numbers should come from the store for sales and returns, and from the ad platforms only for spend. Shopify profit tracking covers setting this up properly.
Common mistakes
Checking today. A half-finished day always looks worse than a full one.
Comparing with yesterday. Different weekdays sell differently. Use the same weekday last week.
Reacting to one day. Single days inside the normal range are noise. Wait for a pattern.
Using platform ROAS as the daily number. Meta and Google can both claim the same order. Store-wide return on ads can't double count.
Changing campaigns every morning. Daily checks find problems; weekly reviews fix campaigns. Mixing them leads to over-steering.
Frequently asked questions
What should I check every day on Shopify?
Yesterday's sales, ad spend, store-wide return on ads, cost per order against break-even, and returns. Compare each with the same weekday last week and the 7-day average.
How do I know if a bad day is just noise?
For order counts, a rough normal range is the daily average plus or minus twice its square root. With 20 orders a day that's about 11 to 29. Days inside the range are usually chance.
Should I change budgets based on one day?
Usually not. Wait until a number has been off for three days, or is far outside its normal range, unless something is clearly broken, such as a disapproved ad or a stopped checkout.
Is ROAS or MER better for a daily check?
Store-wide return on ads, often called MER, is better day to day because no ad platform decides what counts. Use platform ROAS in the weekly review to compare campaigns.
How long should a daily check take?
About five minutes once the numbers are in one place. If gathering them takes longer, a profit dashboard or a fixed spreadsheet saves most of the time.