10 Ecommerce KPIs for Shopify Stores That Run Ads (With Formulas)
The ten numbers worth watching when a Shopify store runs Meta or Google ads, from profit after ads and MER to CAC and return rate, with formulas and how often.
On this page
The ecommerce KPIs that matter most for a Shopify store running ads are the ones that end in profit: profit after ads, contribution margin, revenue after returns, MER, ROAS against break-even and new-customer CAC. Store KPIs such as conversion rate, average order value, return rate and repeat purchase rate explain why those numbers move. Track the ten below on a fixed rhythm, mostly from Shopify, and treat ad-platform metrics as diagnostics, not results.
Key takeaways
- Start from profit after ads. Every other KPI explains why it went up or down.
- Use Shopify as the source of truth for revenue, orders and customers; use ad platforms to diagnose.
- MER and new-customer CAC show whether ads work across the whole store, where no platform can inflate them.
- Return rate and repeat purchase rate move slowly but change profit more than most daily metrics.
- Check spend daily, ad KPIs weekly, and profit, returns and repeat rate monthly.
The 10 KPIs at a glance
| KPI | Formula | Where to find it |
|---|---|---|
| 1. Profit after ads | Contribution margin − ad spend | Your P&L or profit dashboard |
| 2. Contribution margin | Revenue − product cost, shipping, fees and returns | Shopify orders plus your costs |
| 3. Revenue after returns | Sales − discounts − refunds, without tax | Shopify sales reports |
| 4. MER | Store revenue ÷ total ad spend | Shopify revenue and each ad platform's spend |
| 5. ROAS vs break-even | ROAS beside 1 ÷ contribution margin | Ad platforms and Shopify |
| 6. New-customer CAC | Ad spend ÷ new customers | Shopify customers and ad spend |
| 7. Conversion rate | Orders ÷ sessions | Shopify analytics |
| 8. Average order value | Revenue ÷ orders | Shopify analytics |
| 9. Return rate | Returned or refunded orders ÷ orders | Shopify orders and refunds |
| 10. Repeat purchase rate | Customers with 2+ orders ÷ all customers | Shopify customer reports |
Profit KPIs
1. Profit after ads
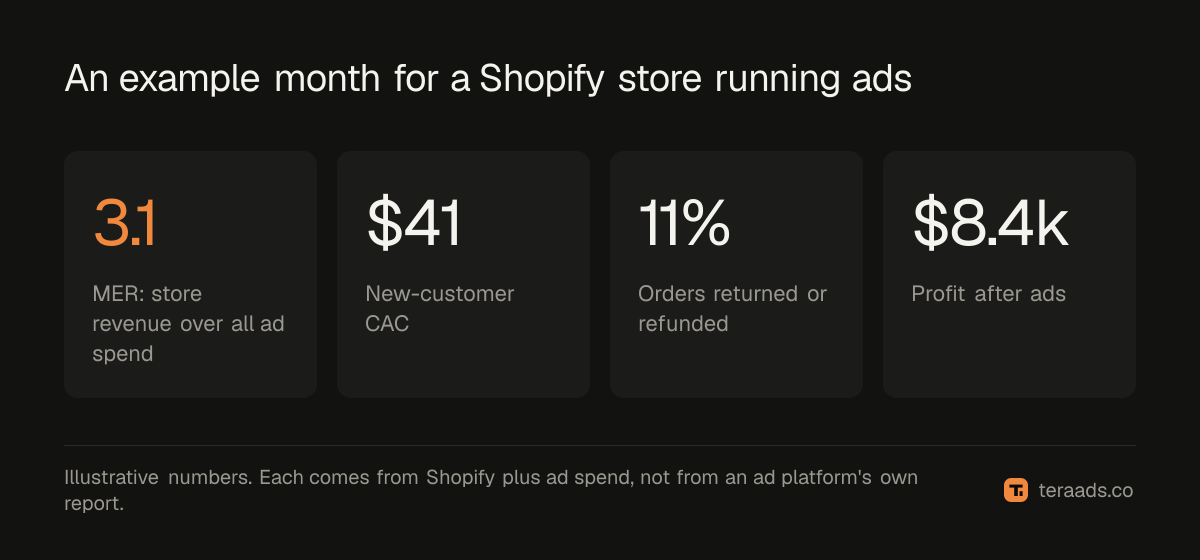
The one number that says whether the business made money from selling this month: contribution margin minus ad spend. It is sometimes called CM3 or contribution after marketing. Fixed costs such as rent, salaries and software come after it. If profit after ads is falling, the rest of this list tells you why.
2. Contribution margin
What sales leave after the costs each order causes: product cost, shipping, payment fees and returns. Track it in dollars and as a share of revenue. It sets your break-even ROAS and how much you can pay for a customer. Contribution margin for D2C brands explains how to calculate it in layers.
3. Revenue after returns
Sales after discounts, without sales tax or VAT, minus refunds. This is the revenue you actually keep, and the right top line for every other ratio. Refunds arrive weeks after orders, so last month's figure will keep falling for a while; a monthly P&L shows where returns belong.
Ad KPIs
4. MER
The marketing efficiency ratio: total store revenue divided by total ad spend across every platform. Because it uses your own sales total, it can't be inflated by platforms claiming the same order. If MER holds while you scale, the ads are adding sales. MER vs ROAS shows how to use it.
5. ROAS against break-even
ROAS on its own is a revenue number. Put it beside your break-even ROAS, which is 1 divided by contribution margin, and it becomes a profit signal. Use platform ROAS to compare ads within a platform, and Shopify ROAS after returns to judge whether the spend pays. What is a good ROAS shows how to set the target.
6. New-customer CAC
Ad spend divided by the number of first-time customers in the same period. It tells you what it costs to grow, which returning-customer sales can hide. Compare it with what a new customer's first order leaves, and with what they leave over six or twelve months. Blended CAC covers the variations.
Store KPIs
7. Conversion rate
Orders divided by sessions. It moves with traffic quality as much as with the store itself: a burst of cheap ad traffic lowers it, a sale raises it. Track it by traffic source, and compare the same source over time rather than against a general benchmark. Shopify conversion rate shows how to read the funnel behind it.
8. Average order value
Revenue divided by orders. A higher AOV spreads shipping and ad costs over more revenue, which raises contribution margin per order. Bundles, free shipping thresholds and add-ons are the usual levers; ways to increase AOV covers them.
9. Return rate
The share of orders returned or refunded. Returns cost shipping both ways and earn nothing, so a small rise can wipe out the profit a campaign seemed to make. Track it by product and by month of order. The real cost of returns shows how to price it in.
10. Repeat purchase rate
The share of customers who have ordered more than once, measured over a fixed window such as twelve months. It decides how much you can afford to pay for a first order. Repeat purchase rate and cohort analysis show how to measure it without fooling yourself.
How often to check each
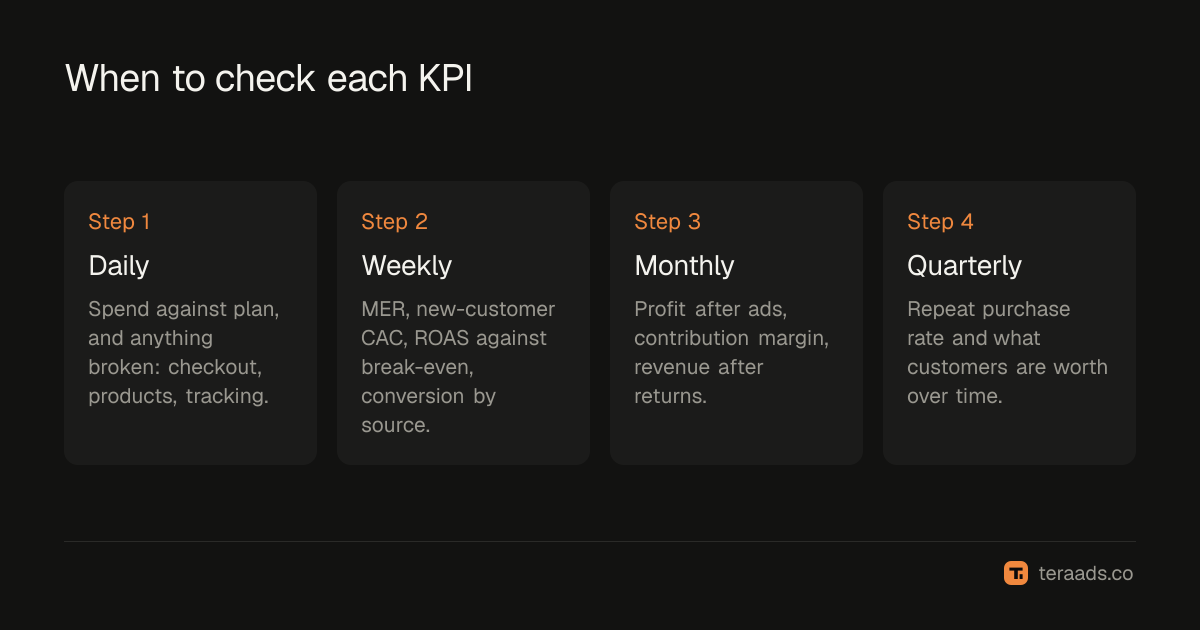
- Daily: spend and breakage. Ad spend against plan, and anything obviously broken: checkout errors, disapproved products, tracking gaps.
- Weekly: ad KPIs. MER, new-customer CAC and ROAS against break-even, plus conversion rate by source.
- Monthly: profit KPIs. Profit after ads, contribution margin and revenue after returns, once most of the month's returns are in.
- Quarterly: customer KPIs. Repeat purchase rate and what customers are worth over time, which move too slowly to read weekly.
Metrics to watch less
Click-through rate, cost per thousand impressions, reach, followers and platform-reported ROAS on its own are useful for diagnosing ads, but none of them is a result. A rising click-through rate with falling profit after ads is still a bad week. Keep them one level down, and look at them when a KPI above moves and you need to know why.
Tera Ads connects Shopify, Google Ads and Meta Ads, and shows every campaign from both platforms in one table with the ROAS each platform reports, beside your store's profit after product costs, ad spend, shipping, payment fees, returns and refunds. It is free for one business.
Frequently asked questions
What are the most important ecommerce KPIs?
For a store running ads: profit after ads, contribution margin, revenue after returns, MER, ROAS against break-even and new-customer CAC. Conversion rate, average order value, return rate and repeat purchase rate explain why those move.
What KPIs should a Shopify store track?
Start with the ten in this guide. Most come straight from Shopify: sales after returns, orders, sessions, customers and refunds. Add ad spend from each platform and your product, shipping and fee costs to complete the profit KPIs.
How do you calculate MER?
Divide total store revenue for a period by total ad spend across every platform in the same period. $60,000 of revenue on $20,000 of ad spend is an MER of 3.
What is the difference between CAC and CPA?
CPA, cost per acquisition, is usually what an ad platform reports per conversion, including repeat buyers. CAC is ad spend divided by new customers, so it is higher and closer to what growth really costs.
What is a good conversion rate for a Shopify store?
It varies widely by product, price and traffic source, so general benchmarks are of little use. Track your own conversion rate by traffic source over time, and judge changes against your own history.
How often should I review ecommerce KPIs?
Spend daily, ad KPIs weekly, profit KPIs monthly once returns are in, and customer KPIs such as repeat purchase rate quarterly.