How to Calculate ROAS: The Formula, Examples and What to Count
ROAS is revenue from ads divided by ad spend. How to calculate it, which revenue to count (tax, shipping, returns) and how to check it against Shopify orders.
On this page
ROAS, or return on ad spend, is the revenue your ads brought in divided by what you spent on them: $5,000 of sales from $1,000 of ads is a 5x ROAS, or 500%. The formula is simple. The hard part is deciding which revenue to count. For a Shopify store, count sales after discounts, leave out sales tax or VAT, and take out returns and refunds before you compare ROAS with your break-even.
Key takeaways
- ROAS = revenue from ads ÷ ad spend. Write it as a ratio (5x), a percentage (500%) or "$5 per $1".
- Leave sales tax and VAT out of revenue; they belong to the government, not to you.
- Take refunds and returns out to get the ROAS you actually keep, often called true ROAS.
- Ad platform ROAS and Shopify ROAS differ because each counts sales its own way. Use both, for different jobs.
- ROAS is a revenue number. Compare it with your break-even ROAS to know whether ads make money.
The ROAS formula
ROAS divides the revenue an ad, campaign or channel produced by the money spent on it:
ROAS = revenue from ads ÷ ad spend
The same number can be written three ways:
- As a ratio: $8,000 ÷ $2,000 = 4, written 4x or 4:1.
- As a percentage: multiply by 100, so 4x is 400%.
- In dollars: $4 of revenue for every $1 spent.
All three mean the same thing. A ROAS of 1x (100%) means ads brought in exactly what they cost in revenue, which is still a loss once product cost, shipping and fees are paid. A ROAS below 1x means ads brought in less revenue than they cost.
In a spreadsheet, put revenue in column B and spend in column C, and use =B2/C2 for the ratio. Format the cell as a percentage if you prefer 400% to 4.
Worked examples
Three illustrative campaigns from one month, using revenue from Shopify orders after discounts and without sales tax:
| Campaign | Ad spend | Revenue | ROAS | As a percentage |
|---|---|---|---|---|
| Prospecting, new audiences | $4,000 | $9,200 | 2.3x | 230% |
| Retargeting, site visitors | $1,000 | $6,500 | 6.5x | 650% |
| Google Shopping | $3,000 | $10,800 | 3.6x | 360% |
| All three | $8,000 | $26,500 | 3.3x | 331% |
The total is not the average of the three ROAS figures. Add up revenue and spend first, then divide: $26,500 ÷ $8,000 = 3.31x. Averaging the three ratios would give 4.1x, because it gives the small retargeting budget the same weight as the large prospecting one.
The table also shows why a single ROAS can mislead. Retargeting looks best, but many of the people it reaches were already likely to buy. What is a good ROAS covers how to judge campaigns of different kinds.
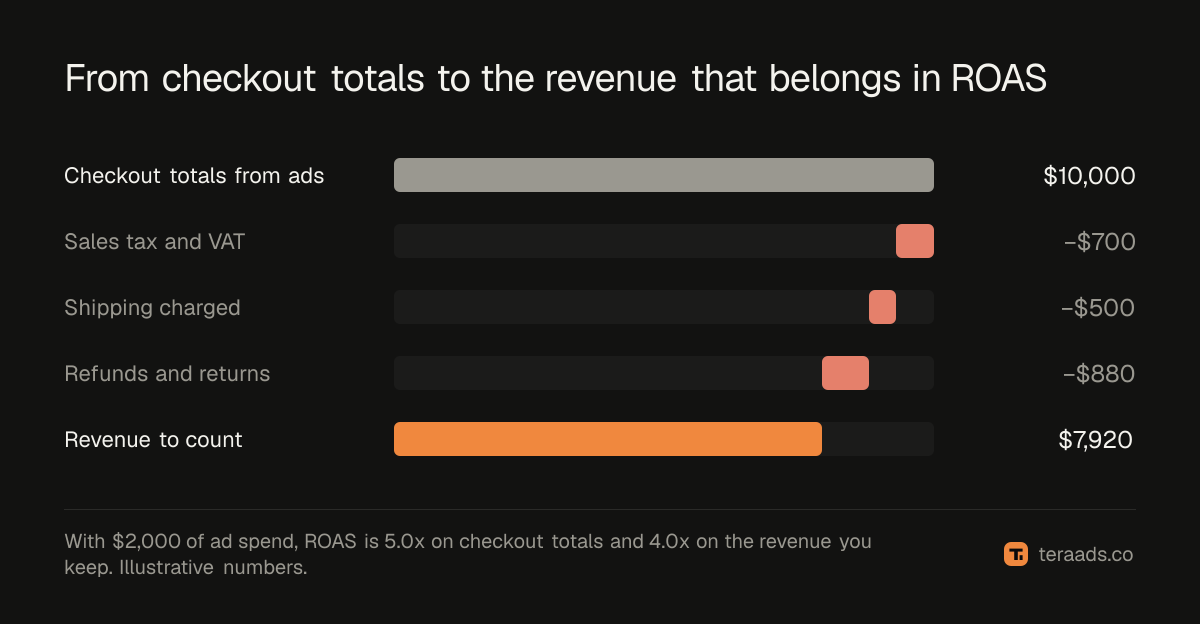
Which revenue to count
Most disagreements about ROAS are really about the top of the fraction. Decide once, write it down, and count the same way every month.
| Item in the order total | Count it in ROAS revenue? | Why |
|---|---|---|
| Discounts | No, use the price after discount | The customer never paid it |
| Sales tax or VAT | No | You collect it for the government |
| Shipping charged to the customer | Your choice, but be consistent | Count it only if you also count shipping costs |
| Orders later refunded or returned | No, for true ROAS | You don't keep the money |
| Canceled or unpaid orders | No | No sale happened |
Sales tax and VAT are the most common mistake for stores selling in the UK, EU, Canada and Australia, where prices often include VAT or GST. A $120 order that includes 20% VAT is $100 of revenue. Sales tax, VAT and ROAS covers the rules for each.
Which spend to count
For ROAS, spend is what you paid the ad platform for the campaign or channel you are measuring. Keep it to media spend: what Meta, Google or another network billed you.
Agency fees, creative production, software and staff are real costs, but adding them turns ROAS into something closer to ROI. That is useful, just a different number. ROAS vs ROI explains the difference with an example.
For a store-wide view, add up every ad platform's spend and divide total store revenue by it. That is MER, the marketing efficiency ratio, and because it uses your own sales total, no platform can inflate it. MER vs ROAS shows how to use the two together.
Platform ROAS and Shopify ROAS
The ROAS in Ads Manager or Google Ads uses the platform's own count of sales. Meta and Google each credit conversions inside their attribution windows, and both can include some sales after someone saw an ad without clicking. When both platforms reached the same buyer, both can claim the order.
Shopify counts each order once. So add up the ROAS each platform reports and you will usually get more revenue than your store actually took. Why Meta Ads and Shopify never agree covers the reasons in detail.
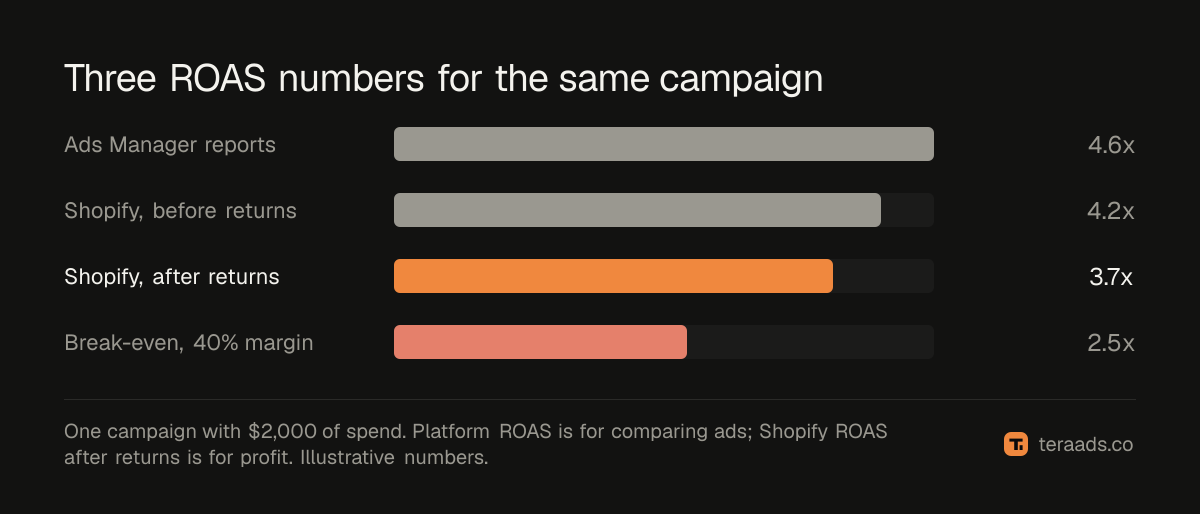
Both numbers have a job. Platform ROAS is what the platform optimizes on, so it is the right number for comparing ads and audiences inside one platform. Shopify ROAS after returns is the right number for deciding whether the spend makes money.
Calculate true ROAS after returns
True ROAS uses only the revenue you keep:
True ROAS = (revenue − refunds and returns) ÷ ad spend
Say a campaign spent $2,000 and Shopify shows $8,300 of orders from it, after discounts and without tax. Over the next six weeks, $830 of those orders are refunded. True ROAS is ($8,300 − $830) ÷ $2,000 = 3.7x, against 4.2x before returns.
Refunds arrive weeks after the order, so true ROAS for a recent week will keep falling as returns come in. Judge a month only once its return window has mostly passed. True ROAS after refunds has the full method.
From ROAS to profit
ROAS is a revenue number, so on its own it can't tell you whether ads make money. For that, compare it with your break-even ROAS: 1 divided by your contribution margin after product cost, shipping, payment fees and returns. With a 40% margin, break-even is 2.5x, so the 3.7x true ROAS above is profitable, and a 2.3x prospecting campaign is not on its first orders. Break-even ROAS has the formula and a worked example.
Tera Ads connects Shopify, Google Ads and Meta Ads, and shows every campaign from both platforms in one table with the ROAS each platform reports, beside your store's profit after product costs, ad spend, shipping, payment fees, returns and refunds. It is free for one business.
Frequently asked questions
What is the formula for ROAS?
ROAS = revenue from ads ÷ ad spend. If ads cost $1,500 and brought in $6,000 of sales, ROAS is 4x, or 400%. Use revenue after discounts and without sales tax or VAT.
Is ROAS a percentage or a ratio?
Either. A ROAS of 4 can be written 4x, 4:1, 400% or "$4 per $1 spent". They all mean the same thing, so pick one style and use it everywhere.
Does ROAS include shipping?
It can, as long as you are consistent. If you count shipping charged to customers as revenue, count what shipping costs you too when you work out margin. Many stores leave shipping out of both to keep things simple.
Should I include sales tax or VAT in ROAS?
No. Sales tax and VAT are collected for the government, so they are not your revenue. Including them makes ROAS look higher than it is, by up to the tax rate.
How do I calculate ROAS for the whole store?
Add up the revenue each campaign produced and the spend, then divide the totals. For a store-wide view that no platform can inflate, divide total store revenue by total ad spend instead: that is MER.
Why is my ROAS in Meta higher than in Shopify?
Meta counts sales inside its attribution window, including some sales after an ad view without a click, and may count orders another channel also claims. Shopify counts each order once. Expect the platform number to be higher.