What Is a Good ROAS for Shopify? Work It Out From Your Margin
There is no universal good ROAS. For a Shopify store it is any ROAS above break-even, which comes from margin. Break-even by margin, and how to set a target.
On this page
A good ROAS for a Shopify store is any ROAS above its break-even ROAS, and break-even comes from your margin, not from an industry average. A store that keeps 50% of each sale after product cost, shipping, fees and returns breaks even at 2x; a store that keeps 25% needs 4x. Work out yours, aim above it by the profit you want, and measure it on Shopify orders after returns.
Key takeaways
- There is no good ROAS for everyone. The same 3x makes money for one store and loses money for another.
- Break-even ROAS is 1 divided by your contribution margin. A 40% margin breaks even at 2.5x.
- A target ROAS adds the profit you want to keep: with a 40% margin, keeping 10% of revenue needs about 3.3x.
- Judge ROAS on sales after returns and refunds, not on the number in Ads Manager or Google Ads.
- A ROAS below break-even can be fine for new customers who buy again, if you know the payback.
Why "aim for 4x" is the wrong answer
Ask what a good ROAS is and you will usually hear a single number, often 3x or 4x. The trouble is that ROAS only measures revenue. It says nothing about what that revenue costs you to deliver.
Take two stores that each spend $10,000 on ads and get $30,000 in sales, a 3x ROAS. The first sells skincare it makes cheaply and keeps 50% of each sale after product cost, shipping, payment fees and returns. The second sells electronics on thin margins and keeps 25%.
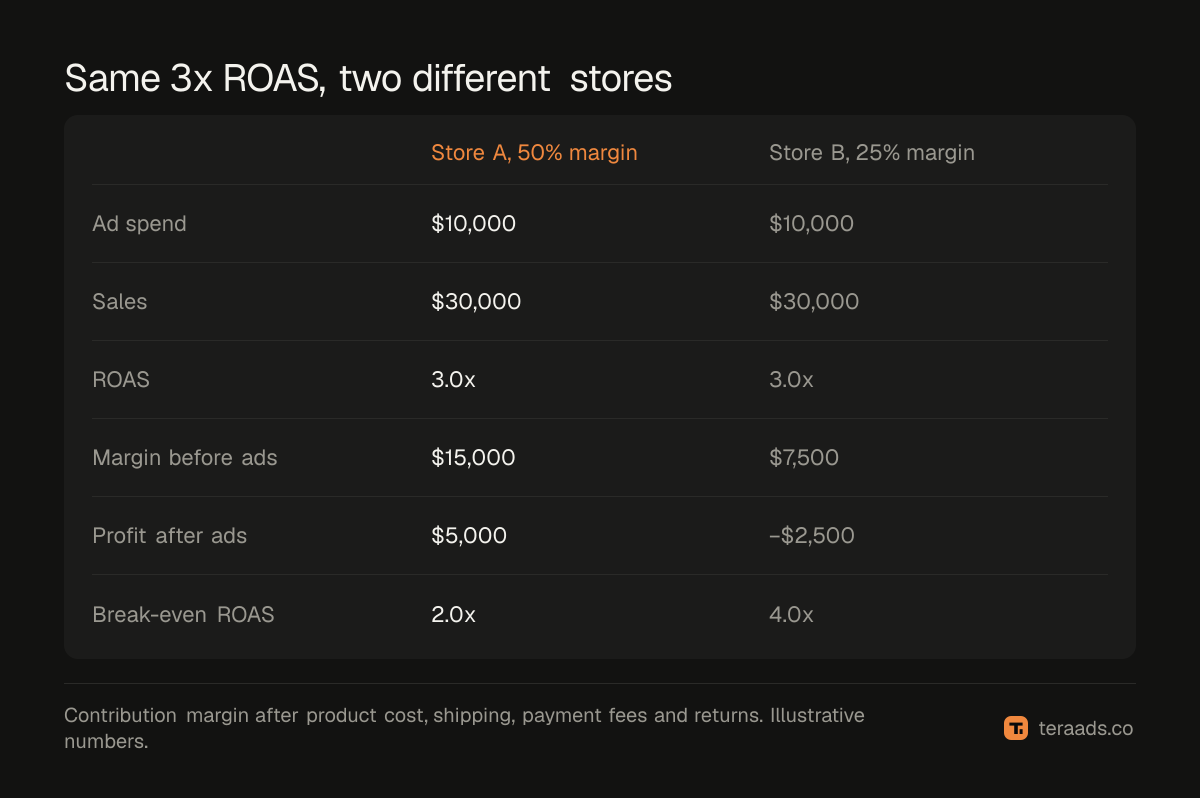
The first store has $15,000 of margin before ads and $5,000 left after them. The second has $7,500 of margin and loses $2,500. Same ROAS, opposite results. That is why the useful question is not "what is a good ROAS" but "what ROAS does my margin need".
Published ROAS averages have the same problem. They mix stores with different margins, products, return rates and attribution settings, so an average tells you little about your own break-even. Use your own numbers instead.
Break-even ROAS by margin
Break-even ROAS is the ROAS at which ads exactly pay for themselves: 1 divided by your contribution margin as a share of revenue. Contribution margin is what a sale leaves after product cost, shipping, payment fees and returns, before ad spend. Break-even ROAS walks through the formula in full.
| Contribution margin | Break-even ROAS | ROAS to keep 10% of revenue as profit |
|---|---|---|
| 20% | 5.0x | 10.0x |
| 25% | 4.0x | 6.7x |
| 30% | 3.3x | 5.0x |
| 35% | 2.9x | 4.0x |
| 40% | 2.5x | 3.3x |
| 50% | 2.0x | 2.5x |
| 60% | 1.7x | 2.0x |
| 70% | 1.4x | 1.7x |
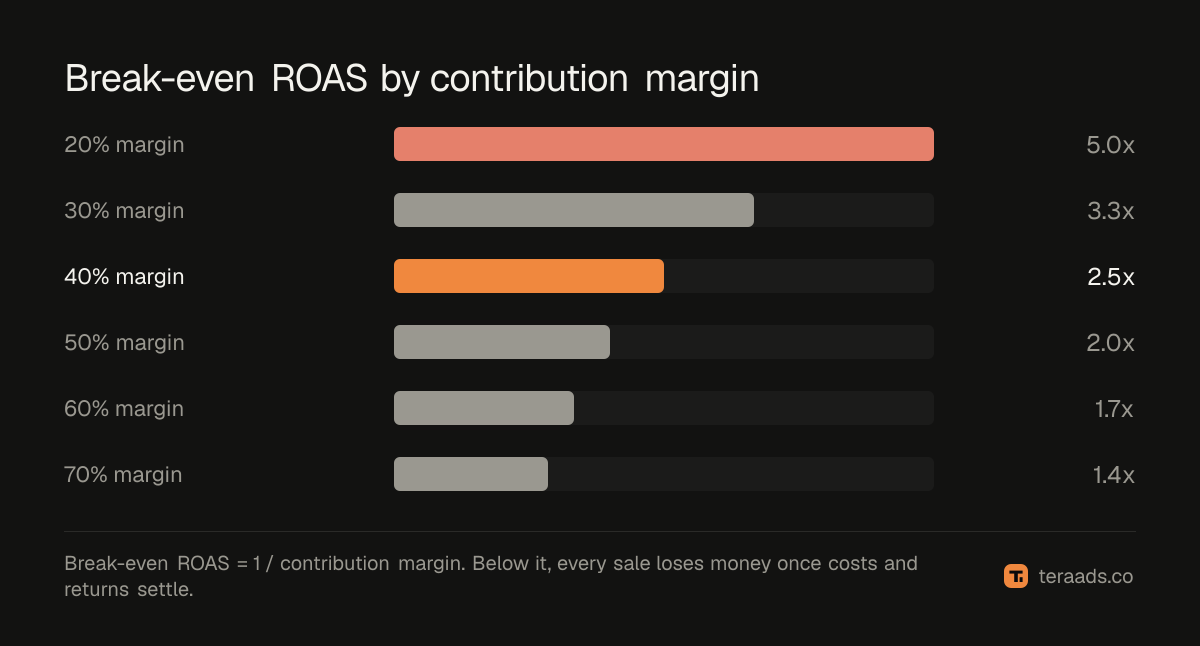
Two things stand out. Low-margin stores need far higher ROAS, and the gap widens quickly below 30%. And the profit you want on top of break-even matters more the thinner your margin: at 20% margin, keeping a tenth of revenue doubles the ROAS you need.
Work out your own margin per order
Most stores overestimate their margin because they use gross margin, which only takes out product cost. Contribution margin also takes out the costs that come with every order.
Here is an illustrative store selling $60 orders:
- Product cost: 40% of the price, so $24.
- Payment fees: about 3% of the order, so $1.80.
- Shipping out: $6 an order.
- Returns: 10% of orders come back, with $6 return shipping, and the product goes back into stock.
A delivered order leaves $60 − $24 − $1.80 − $6 = $28.20. But one order in ten comes back: it earns nothing, costs $12 in shipping both ways, and refunds the customer. Averaged over all orders placed, each one leaves about $24.18, or 40.3% of the $60 price. Break-even ROAS is $60 ÷ $24.18 = 2.48x.
Sales tax and VAT are not revenue, so they come out before any of this. Sales tax, VAT and ROAS covers how to strip them out, and payment fees and profit covers the fee side.
To keep 10% of revenue as profit, this store can spend at most $24.18 − $6 = $18.18 on ads per order, so its target ROAS is $60 ÷ $18.18 = 3.3x. Anything between 2.48x and 3.3x keeps the lights on but misses the profit goal.
Compare the right ROAS with break-even
Your break-even is worked out on money you actually keep. The ROAS you compare it with has to be counted the same way, and the number in the ad platform usually isn't.
- Ads Manager and Google Ads count conversions inside their attribution windows, including some sales after a view rather than a click, and both can claim the same order.
- Shopify orders count each sale once, but still include orders that are later refunded.
- Shopify orders after returns are the closest to the money you keep.
If Meta reports 3x but Shopify shows 2.6x after returns, a 2.48x break-even leaves almost nothing. True ROAS after refunds shows the calculation, and MER vs ROAS shows the store-wide check: total revenue over total ad spend, which no platform can inflate.
When a ROAS below break-even is fine
Break-even on the first order is not always the goal. If customers come back and buy again, you can spend more to win them than one order pays for, as long as you know how long it takes to earn it back.
Say a new customer's first order leaves $24 and they buy again within six months often enough to add another $20 on average. You could pay up to $44 to acquire them and still break even over six months. CAC payback period shows how to work that out from your own repeat rate.
This only works if the repeat purchases are real and measured, not assumed. It also applies to new customers only: a campaign that mostly reaches existing customers should clear break-even on its own.
Why some campaigns look better than others
Different campaign types report very different ROAS, and the highest numbers are often the least reliable.
- Retargeting and existing customers report the highest ROAS, because many of those people were already likely to buy. Judge them on the sales they add, not the sales they touch.
- Brand search looks excellent for the same reason: people searching your store's name were already coming. Brand vs non-brand search explains how to judge it separately.
- Prospecting to new audiences reports the lowest ROAS, but it is where new customers come from.
A blended view keeps you honest. If prospecting is cut because its ROAS looks weak and total sales fall, it was doing more than its ROAS showed. Incrementality testing covers how to measure that.
Set your target ROAS in four steps
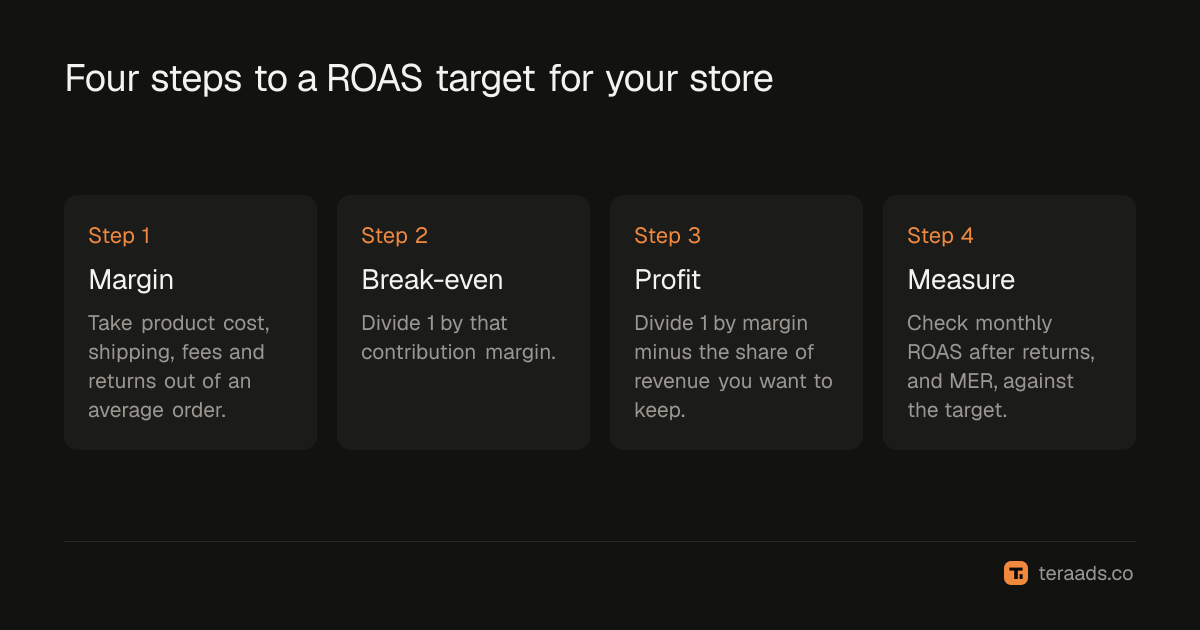
- Work out contribution margin. Take product cost, shipping, payment fees and returns out of an average order.
- Find break-even. Divide 1 by that margin, or the average order value by the margin per order.
- Add the profit you want. Divide 1 by margin minus the share of revenue you want to keep.
- Measure on Shopify after returns. Check each month's real ROAS and MER against the target, then adjust budgets.
Recheck the target whenever prices, product costs, shipping rates or return rates change. A price increase or a cheaper supplier lowers break-even; free shipping or a sale raises it.
Tera Ads connects Shopify, Google Ads and Meta Ads, and shows every campaign from both platforms in one table with the ROAS each platform reports, beside your store's profit after product costs, ad spend, shipping, payment fees, returns and refunds. It is free for one business.
Frequently asked questions
What is a good ROAS for Facebook ads?
A good Facebook (Meta) ads ROAS is one above your break-even ROAS, measured on Shopify orders after returns. With a 40% contribution margin that is above 2.5x; with 25% it is above 4x. The ROAS in Ads Manager usually reads higher than what Shopify shows, so compare like with like.
Is a 3x ROAS good?
It depends on your margin. A 3x ROAS is profitable for a store with a contribution margin above 33%, and loses money below it. At 3x, ads cost a third of revenue: a store with a 50% margin keeps about a sixth of revenue as profit, and one with a 25% margin loses money.
Is a 2x ROAS good?
Only for high-margin stores. At 2x, a store breaks even with a 50% contribution margin and makes money above it. Most stores selling physical products with shipping and returns have lower margins, so 2x usually loses money unless the customers buy again.
What is the average ROAS for ecommerce?
Published averages exist, but they mix stores with different margins, products and attribution settings, so they tell you little about your own store. Your break-even ROAS, worked out from your own margin, is a far better yardstick than any average.
Should ROAS include returns and refunds?
For judging profit, yes. Ad platforms count the sale when the order is placed and do not take out later refunds, so their ROAS is higher than what you keep. Compare your break-even ROAS with ROAS after returns and refunds.
What is the difference between ROAS and ROI?
ROAS is revenue divided by ad spend. ROI is profit divided by what you invested. A campaign can show a strong ROAS and a negative ROI if margins are thin. ROAS vs ROI works through both with an example.