Meta Ads Manager Metrics Explained: The 12 Columns Worth Reading
What the main Meta Ads Manager columns mean, from results and purchase ROAS to frequency and link CTR, which to trust for profit, and a column preset to save.
On this page
Meta Ads Manager has hundreds of columns, but about a dozen answer the questions that matter: what you spent, what it bought, what each result cost, how often people saw the ads and whether they clicked. Read results, cost per result and purchase ROAS for outcomes, frequency, CPM and link click-through rate for why they changed, and the attribution setting for how purchases were counted. Then check purchases against Shopify, because Ads Manager doesn't know about returns or product costs.
Key takeaways
- Start with amount spent, results, cost per result, purchases and purchase ROAS. They are the outcome columns.
- Frequency, CPM and link click-through rate explain why outcomes moved.
- Link CTR counts clicks to your site; CTR (all) also counts likes, comments and profile taps. Use link CTR.
- The attribution setting decides which purchases are counted. Compare campaigns only on the same setting.
- Ads Manager doesn't take out refunds or product costs. Check purchases and revenue against Shopify.
The 12 columns at a glance
| Column | What it tells you | Watch for |
|---|---|---|
| Amount spent | What you paid in the period | Spend against plan |
| Results | Count of the outcome the ad set optimizes for | Which result type it is |
| Cost per result | Amount spent ÷ results | Rising cost per result |
| Purchases | Purchases Meta attributes to the ads | Gap against Shopify orders |
| Purchases conversion value | Revenue Meta attributes to the ads | Tax and refunds included or not |
| Purchase ROAS | Purchases conversion value ÷ amount spent | Compare with break-even, after returns |
| Reach | People who saw the ads at least once | Small reach on a large budget |
| Impressions | Times the ads were shown | Growth without new reach |
| Frequency | Impressions ÷ reach | Steady climb with falling CTR |
| CPM | Cost per 1,000 impressions | Seasonal or audience-driven rises |
| CTR (link click-through rate) | Link clicks ÷ impressions | Falling as creative ages |
| Attribution setting | Which window counts a purchase | Comparing ads on different settings |
Outcome columns
Amount spent is the money spent in the date range. Every other cost metric divides by it.
Results counts whatever the ad set is optimized for: purchases, add-to-carts, leads, link clicks. Cost per result divides spend by that count. Two campaigns with a $20 cost per result can be completely different if one counts purchases and the other counts add-to-carts, so check the result type before comparing.
Purchases and purchases conversion value are the purchases and revenue Meta attributes to the ads, based on events from your pixel and Conversions API. Purchase ROAS divides that value by amount spent. These are the numbers Meta optimizes on, so they are the right ones for comparing ads inside Meta. They are not your profit: refunds aren't taken out, product costs aren't known, and some purchases are also claimed by other channels. Why Meta Ads and Shopify never agree explains the gap.
Delivery columns
Reach is how many people saw an ad at least once; impressions is how many times ads were shown. Frequency is impressions divided by reach: the average number of times each person saw them.
Rising frequency with falling click-through rate is the classic sign of creative fatigue: the same people are seeing the same ads and responding less. Meta Ads frequency covers how to read it for prospecting and retargeting.
CPM is the cost of 1,000 impressions. It rises with competition, especially in Q4, and when audiences are small. A rising CPM pushes up every cost further down. CPM vs CPC vs CPA shows how the three connect.
The delivery column also shows the ad set's status, including "Learning" and "Learning limited". The learning phase explains what those mean.
Click columns
Ads Manager offers two click-through rates, and they measure different things:
- CTR (link click-through rate) counts clicks that lead to your website or app, divided by impressions.
- CTR (all) also counts likes, comments, shares, profile taps and clicks to expand the ad.
For a store, link CTR is the one that matters, because only link clicks can turn into orders. CPC (cost per link click) divides spend by link clicks.
Further down the funnel, adds to cart and checkouts initiated show whether visitors take the next step. If link clicks hold but adds to cart fall, look at the product page, price or stock before blaming the ads.
The attribution setting
The attribution setting column shows which window Meta used to credit purchases: for example, purchases within a number of days after a click, and whether purchases after a view without a click count too. Changing the setting changes the purchases and ROAS reported for the same ads. Compare campaigns only when they use the same setting. Meta attribution windows covers the options and how to choose.
Save a profit-first column preset
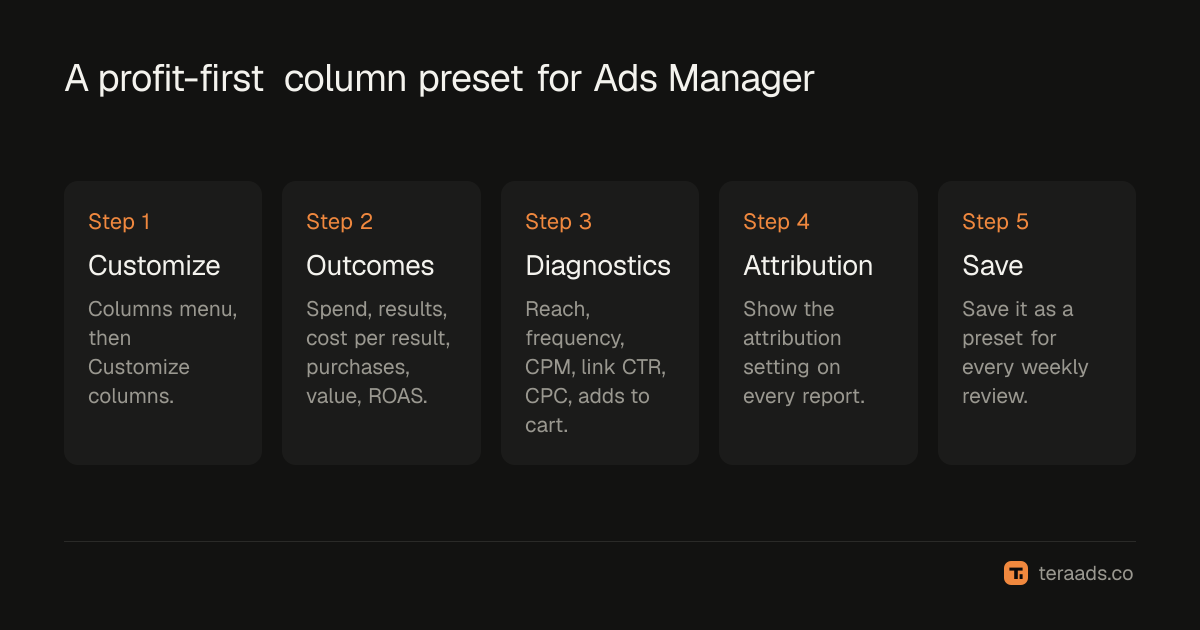
- Open Customize columns. In Ads Manager, open the Columns menu and choose Customize columns.
- Pick the outcome columns. Amount spent, results, cost per result, purchases, purchases conversion value and purchase ROAS.
- Add the diagnostic columns. Reach, frequency, CPM, CTR (link click-through rate), CPC (cost per link click) and adds to cart.
- Add the attribution setting. So every report shows how purchases were counted.
- Save it as a preset. Name it, save it, and use it for every weekly review.
What Ads Manager can't tell you
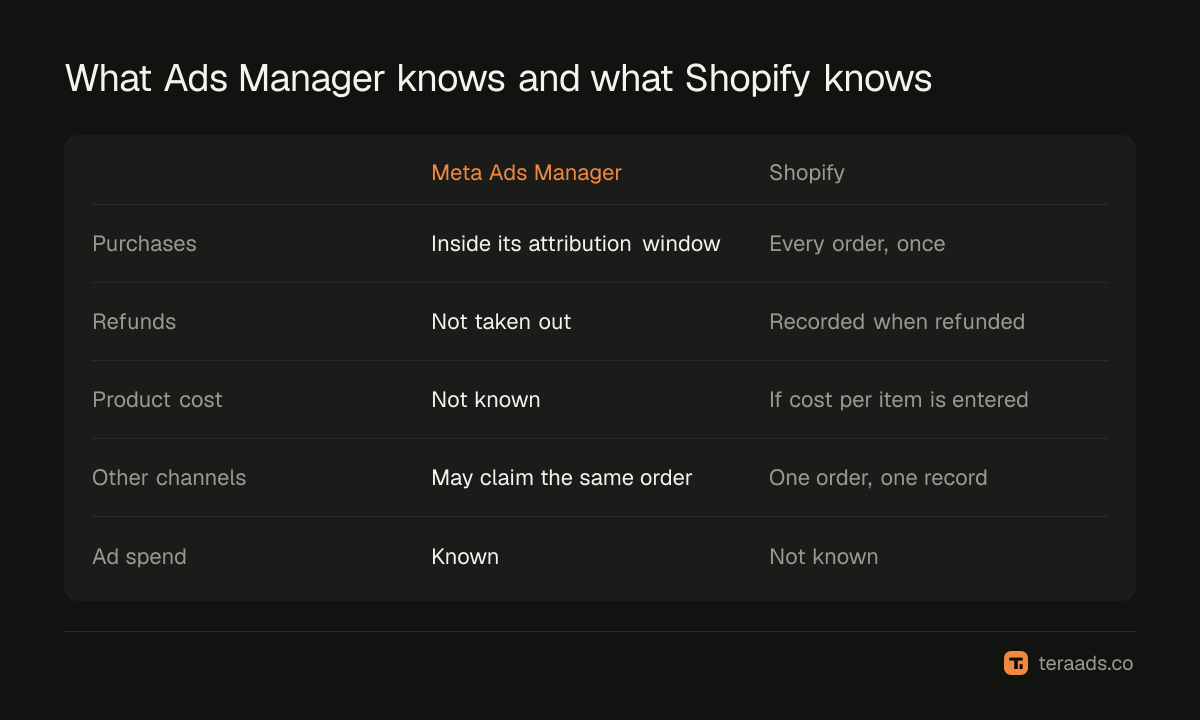
Ads Manager sees ads and the events your store sends back. It doesn't see refunds that happen later, what your products cost, what shipping costs you, or whether another channel also brought the same buyer. So a 3x purchase ROAS can be a healthy profit or a loss, depending on margin and returns.
Put Meta's purchases beside Shopify orders, take out refunds, and compare with your break-even ROAS. Why your Facebook ads aren't profitable walks through those checks.
Tera Ads connects Shopify, Google Ads and Meta Ads, and shows every campaign from both platforms in one table with the ROAS each platform reports, beside your store's profit after product costs, ad spend, shipping, payment fees, returns and refunds. It is free for one business.
Frequently asked questions
What does "Results" mean in Meta Ads Manager?
Results counts the outcome the ad set is optimized for, such as purchases, add-to-carts or link clicks. Cost per result is spend divided by that count. Check the result type before comparing campaigns.
What is purchase ROAS in Ads Manager?
Purchase ROAS is the purchases conversion value Meta attributes to your ads divided by amount spent. It counts purchases inside the attribution setting and doesn't take out refunds, so it usually reads higher than ROAS measured on Shopify orders after returns.
What is the difference between CTR (all) and link CTR?
Link CTR counts only clicks that go to your website or app. CTR (all) also counts likes, comments, shares, profile taps and expanding the ad. For a store, link CTR is the useful one.
What frequency is too high on Facebook ads?
There is no fixed limit. Watch the trend: if frequency keeps rising while link CTR falls and cost per purchase rises, the audience is tiring of the ads and it is time for new creative or a wider audience.
Why don't Ads Manager purchases match Shopify orders?
Meta credits purchases inside its attribution setting, including some after an ad view without a click, and other channels may claim the same orders. Shopify counts each order once. Missing or duplicated pixel events can widen the gap.
Which Ads Manager columns should I check every week?
Amount spent, results, cost per result, purchase ROAS, frequency, CPM, link CTR and adds to cart, with the attribution setting shown. Then compare purchases with Shopify orders for the same week.