Shiprocket RTO Report: Build One That Shows Where Returns Come From
Turn Shiprocket shipment data into an RTO report by courier, pin code, payment mode, product and campaign, and use it to decide what to change first.
On this page
A useful RTO report takes your shipments with their final status and shows the RTO rate by courier, pin code, payment mode, product and ad campaign. Shiprocket holds the shipment outcomes; Shopify holds the campaign that brought each order. Export settled shipments from Shiprocket, join them to Shopify orders by order number, and compare RTO rates across each cut. The cut with the biggest gap between best and worst is where to act first.
Key takeaways
- RTO rate = RTO shipments ÷ (delivered + RTO shipments), on shipments that have reached a final status.
- Use settled shipments only, usually orders at least three weeks old, so in-transit parcels don't distort the rate.
- Shiprocket holds courier, pin code, payment mode and status; Shopify holds the UTM campaign.
- Compare the same rate across five cuts: courier, pin code, payment mode, product and campaign.
- Act on the cut with the widest spread and enough shipments to trust.
What Shiprocket gives you
Shiprocket's shipment records carry most of what an RTO report needs: order number, AWB, courier, destination pin code and city, payment mode, shipment value, dates and current status. Its RTO management page, checked on 8 October 2026, also describes an AI/ML model that flags high-risk orders, automated WhatsApp messages that verify addresses and capture cancellations before shipping, and an automated NDR dashboard. It claims these can "Reduce RTO Losses Up To 45%", without stating a baseline.
Those tools act on single orders. The report below tells you where the problem concentrates, so you know which tools and rules to apply.
Building the report, step by step
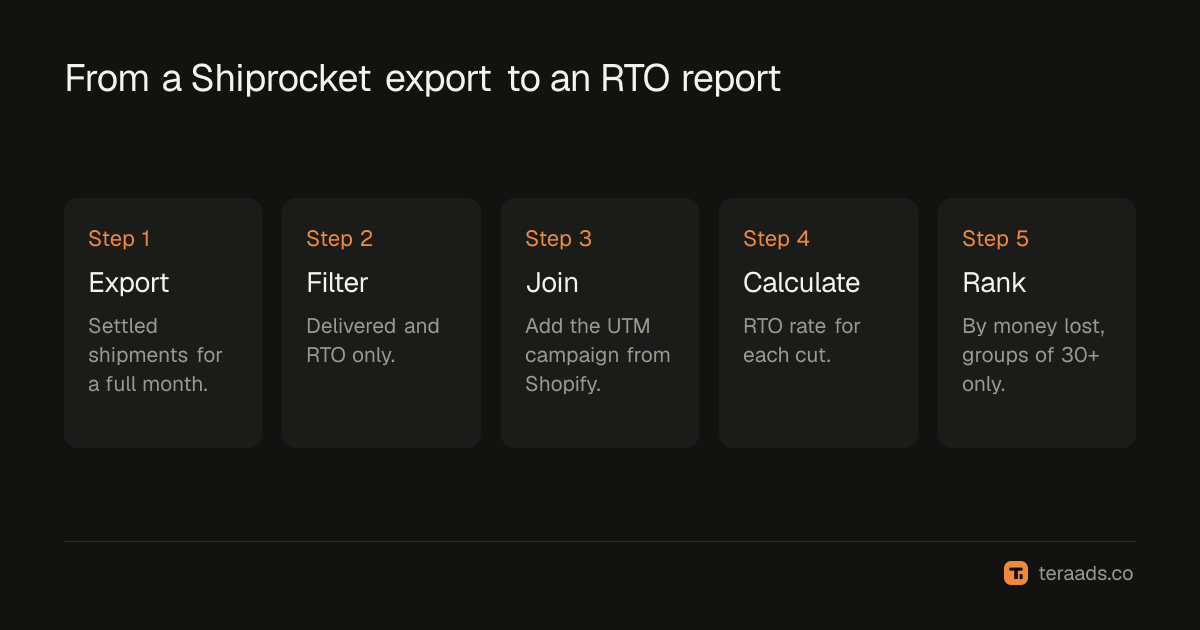
- Export settled shipments. From your Shiprocket panel, export shipments for a full month that ended at least three weeks ago, with order number, AWB, courier, pin code, city, state, payment mode, value and status.
- Keep final statuses only. Keep shipments marked delivered or RTO. Drop cancelled-before-dispatch orders and anything still in transit.
- Add the campaign. Export Shopify orders for the same period with order number and UTM campaign, then match them to shipments by order number.
- Calculate the rate per cut. For each courier, pin code, payment mode, product and campaign, count delivered and RTO shipments and divide.
- Set a minimum sample. Ignore any group with fewer than about 30 settled shipments; small groups swing wildly.
- Rank by money, not just rate. Multiply each group's RTO count by your average cost per RTO to see where losses are largest.
The pin code RTO analysis and RTO by campaign guides go deeper on two of these cuts.
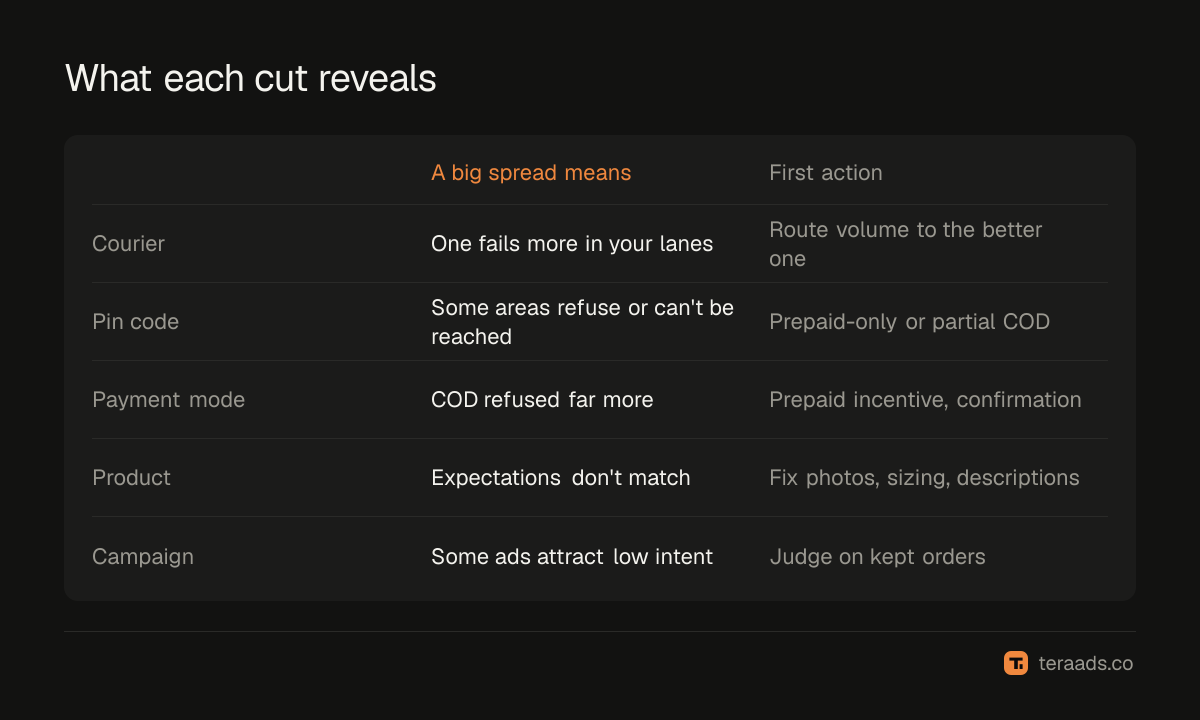
The five cuts and what they tell you
| Cut | What a big spread usually means | First action |
|---|---|---|
| Courier | One courier fails more deliveries in your lanes | Route more volume to the courier that delivers |
| Pin code | Some areas refuse or can't be reached | Prepaid-only or partial COD for the worst pin codes |
| Payment mode | COD buyers refuse far more often than prepaid | Prepaid incentive, order confirmation |
| Product | Expectations don't match the product | Fix photos, sizing and descriptions |
| Campaign | Some ads attract low-intent buyers | Judge campaigns on kept orders, cut the worst |
Reading the report
Start with the overall rate for the month and compare it with the previous three months. A rising trend matters more than the level. Then look for the widest spread:
- Courier: if one courier's RTO rate on your orders is several points higher than another's in the same states, routing alone can save money; choosing couriers to cut RTO covers the rules.
- Pin code: a small set of pin codes usually accounts for a large share of RTO. Restrict COD there before touching anything else.
- Payment mode: almost always the biggest gap. It tells you how much a prepaid shift is worth.
- Product: a product with a far higher RTO rate than the store average often has a description problem, not a buyer problem.
- Campaign: campaigns with similar ROAS can have very different RTO rates. The one with fewer refusals makes more money.
Turning the report into rules
A report is useful only if it changes what happens to the next order. Translate findings into rules you can apply in Shiprocket and Shopify:
- Courier priority: set the better courier first for the states or zones where it wins.
- COD restrictions: block COD or require a partial advance for the worst pin codes; partial COD explains the trade-off.
- Order confirmation: confirm COD orders above a value, or from risky areas, before dispatch; the COD order confirmation guide has scripts.
- Ad budgets: move budget from high-RTO campaigns to those whose orders stay delivered.
Write each rule down with the date it started, so next month's report can show whether it worked.
Checking a rule worked
Compare the same cut before and after the change, on settled shipments only. If you restricted COD in 40 pin codes in September, compare September's RTO rate in those pin codes with August's, and check that total orders from them didn't fall more than the RTO savings. A rule that cuts RTO by a third but loses half the orders isn't a win.
How often to run it
Monthly is enough for most brands, because RTO needs about three weeks to settle. Run a lighter weekly check on two numbers only: NDRs raised in the last seven days and RTO initiations, by courier. A sudden rise in either usually means a courier problem in a region, which is worth acting on before the monthly report catches it. The NDR management guide covers the daily routine.
Common mistakes
Including in-transit shipments. They count as neither delivered nor RTO yet and drag the rate down.
Judging small groups. A pin code with eight shipments and three RTOs isn't a 37% problem; it's noise.
Stopping at the rate. Rank by money lost, because a lower rate on a big courier can cost more than a high rate on a small one.
Skipping the campaign join. Without it, you can't see which ads bring refusals.
Changing many rules at once. You won't know which one worked.
Tera Ads pulls RTO from Shiprocket and joins it to your Shopify orders and Meta Ads and Google Ads campaigns, so profit after returns is shown for every campaign, counted in the month the order was placed. It is free for one business.
Frequently asked questions
How do I calculate RTO rate from Shiprocket data?
Divide RTO shipments by delivered plus RTO shipments, using only shipments that have reached a final status.
Does Shiprocket show RTO by campaign?
Shipment data doesn't include your ad campaign. Join shipments to Shopify orders by order number to add the UTM campaign.
How old should orders be for an RTO report?
At least about three weeks, so most shipments have been delivered or returned. Use a full month that ended three weeks ago.
What is a good minimum sample for RTO analysis?
Around 30 settled shipments per group. Smaller groups produce rates that swing too much to act on.
Which RTO cut should I act on first?
The one with the widest spread between best and worst groups and the most money lost, usually payment mode, pin code or courier.