Shopify Conversion Rate: How to Calculate It, Read It and Raise It
Shopify conversion rate is orders divided by sessions. How to calculate it, find the step where visitors drop off, and why a lower rate can still mean more profit.
On this page
Shopify conversion rate is the share of store sessions that end in an order: orders divided by sessions, times 100. Shopify's analytics shows it beside three steps, sessions that added to cart, reached checkout and completed checkout, so you can see where visitors drop off. There is no universal "good" rate, because it depends on price, products and where the traffic comes from. Compare it with your own past months, channel by channel, and judge it together with order value and margin.
Key takeaways
- Conversion rate = orders ÷ sessions × 100. Shopify counts sessions, not people, so one visitor can be several sessions.
- Read the three steps: add to cart, reach checkout, complete checkout. The weakest step is where to work.
- Traffic mix moves the rate. More cold traffic from ads lowers it, even when the ads make money.
- Profit per session, conversion rate × order value × margin, matters more than the rate alone.
- Discounts raise conversion rate and lower margin; check both before calling a test a win.
How to calculate it
Conversion rate = orders ÷ sessions × 100
A session starts when someone arrives at your store and ends when they stop browsing for a while or leave. If 20,000 sessions in a month bring 400 orders, the conversion rate is 400 ÷ 20,000 × 100 = 2%.
Shopify reports this as the online store conversion rate, under Analytics. It counts sessions that converted, so a session with two orders counts once. Google Analytics, Meta and Shopify all define sessions and visits differently, so their conversion rates rarely match. GA4 vs Shopify explains why. Pick one source for this number and stick with it.
Read the funnel, not just the rate
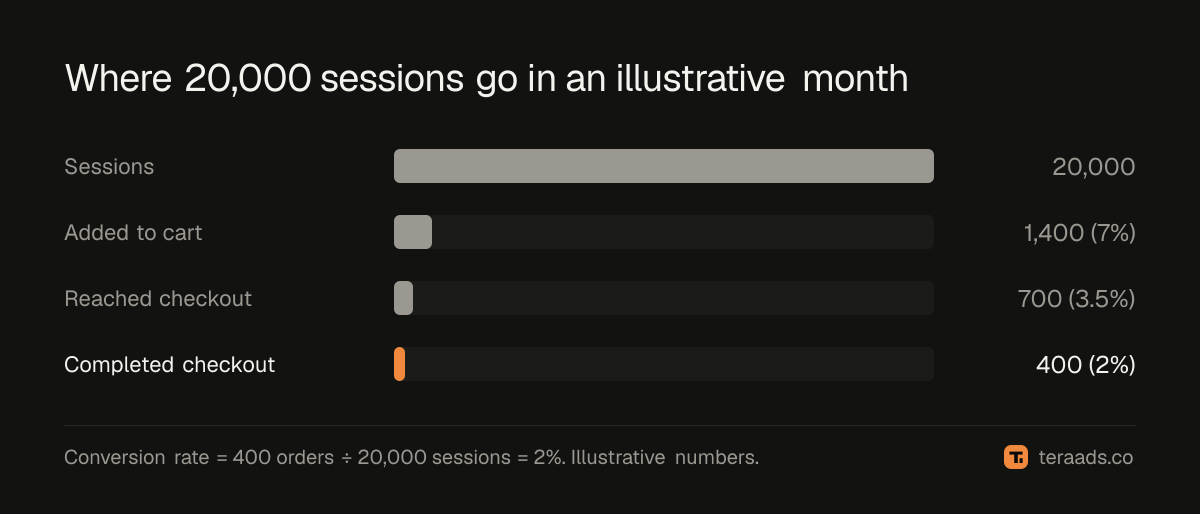
Shopify's conversion rate report breaks the month into steps. In this illustrative store:
- 20,000 sessions
- 1,400 sessions added to cart (7%)
- 700 reached checkout (half of those with a cart)
- 400 completed checkout (57% of those who reached it), a 2% conversion rate
The 2% on its own tells you little. The steps tell you where people stop:
| Step that drops | Usually means | Check first |
|---|---|---|
| Few sessions add to cart | Wrong visitors, weak product pages, price or stock | Ad and landing page match, photos, reviews, mobile speed |
| Carts don't reach checkout | Surprises in the cart, or browsing without intent | Shipping costs shown early, free-shipping threshold, cart page errors |
| Checkouts don't complete | Costs or friction at the last step | Shipping and tax shown at checkout, payment options, express checkout, errors |
| Rate falls on one device | A page that works on desktop and breaks on phones | Test the full path on a phone, not just a resized browser |
Check the steps for each channel too. Shopify's sessions reports can split by referrer and by UTM source, so you can see whether paid social, search and email lose people at the same step. UTM parameters for Shopify shows how to tag campaigns so the split is clean.
Why a lower rate can mean more profit
Conversion rate moves with traffic mix. Visitors from email, brand searches and returning customers buy far more often than people who saw an ad for the first time. So when you scale prospecting ads, the store's rate usually falls, even when the ads add profitable orders.
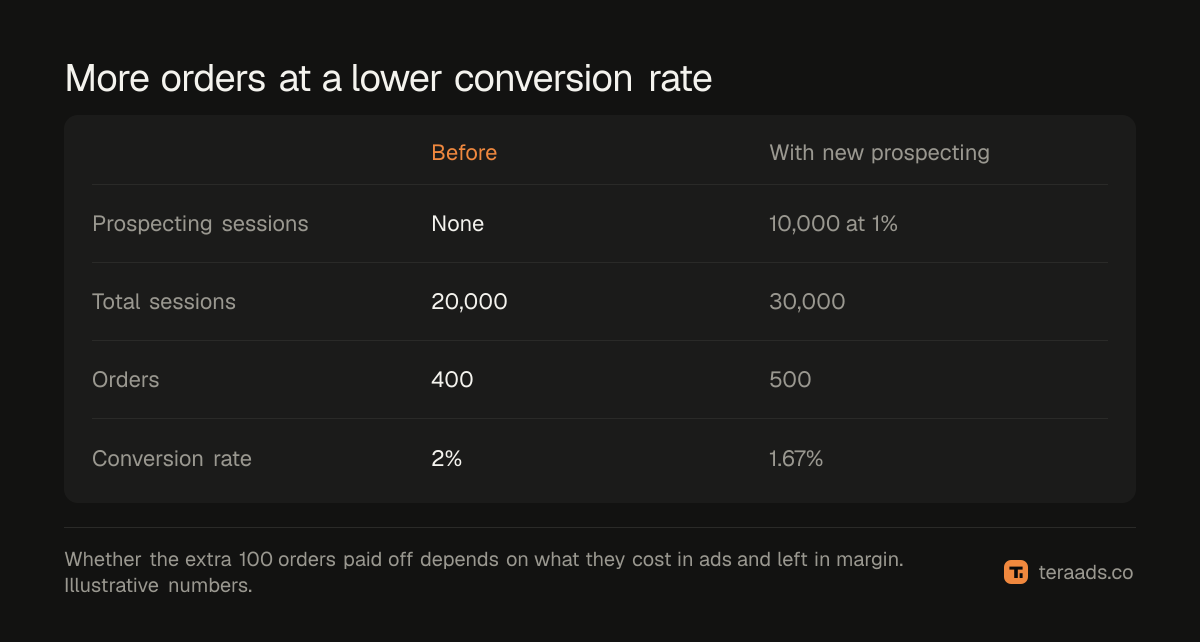
In this example the store adds 10,000 sessions from new Meta prospecting that convert at 1%. Total sessions rise to 30,000 and orders to 500, so the conversion rate falls from 2% to 1.67%. The store got 100 more orders. Whether that was good depends on what those 100 orders cost in ads and left in margin, not on the rate.
That is why a better number to watch is profit per session:
Profit per session = conversion rate × average order value × contribution margin
A store converting 2% at $60 orders with a 40% margin earns $0.48 of margin per session before ads. If a 20% discount lifts conversion to 2.4% but cuts the margin to 25% of the lower price, each session earns 2.4% × $48 × 25% = about $0.29. More orders, less money. Discount cost calculator works through the sums.
How to raise conversion rate without giving away margin
Start at the weakest step in the funnel, and prefer fixes that don't cost margin:
- Match ads to landing pages. The page should show the product, price and offer the ad promised. A mismatch loses people before they add to cart.
- Make product pages answer the questions. Clear photos, sizes, materials, delivery times, returns policy and reviews.
- Show shipping costs early. Unexpected costs at checkout are a common reason people leave. A free-shipping threshold can lift both conversion and order value if it is set from margin.
- Speed up mobile pages. Most ad traffic arrives on phones. Heavy apps, large images and pop-ups slow the first screen.
- Offer express checkout. Shopify supports accelerated checkouts such as Shop Pay, Apple Pay and Google Pay, which save buyers typing.
- Test one change at a time. Run a change for long enough to cover a full week of traffic, and compare profit per session, not just the rate.
If more people should buy but the rate stays low, look at the traffic before the store. Cheap clicks from broad placements and audiences that never buy lower the rate and waste ad spend; find wasted ad spend shows where to look.
Where conversion rate fits with your other numbers
Conversion rate is one link in a chain. On the ad side, it turns cost per click into cost per sale: CPA = CPC ÷ conversion rate, as CPM vs CPC vs CPA explains. On the store side, revenue = sessions × conversion rate × average order value. Ecommerce KPIs for Shopify puts it beside the other weekly numbers.
Tera Ads connects Shopify, Google Ads and Meta Ads, and shows every campaign from both platforms in one table with the ROAS each platform reports, beside your store's profit after product costs, ad spend, shipping, payment fees, returns and refunds. It is free for one business.
Frequently asked questions
What is a good conversion rate for a Shopify store?
There is no single good number. It depends on price, products, how many visitors come from ads and how many are returning customers. Compare it with your own past months by channel, and with profit per session, rather than with someone else's store.
How does Shopify calculate conversion rate?
Shopify divides the sessions that resulted in an order by total online store sessions in the period. A session with more than one order counts once. The report also shows the sessions that added to cart and reached checkout.
Why is my Shopify conversion rate dropping?
Check traffic mix first: more sessions from new ads or bots lower the rate without anything breaking. Then look at which funnel step fell, by device and channel, and check for price, stock, shipping or checkout changes in the same week.
Why is my Shopify conversion rate different from Google Analytics?
They count sessions differently, and GA4 can miss visitors who block cookies or tracking. Shopify counts orders directly. Use one source consistently and expect the other to differ.
Does a higher conversion rate mean more profit?
Not always. Discounts and cheap products can lift the rate while lowering margin. Check profit per session: conversion rate × average order value × contribution margin.
How do I increase my Shopify conversion rate?
Find the weakest funnel step, then fix it: ad and page match for add to cart, early shipping costs for reaching checkout, and express payment options for completing it. Test one change at a time over at least a week.